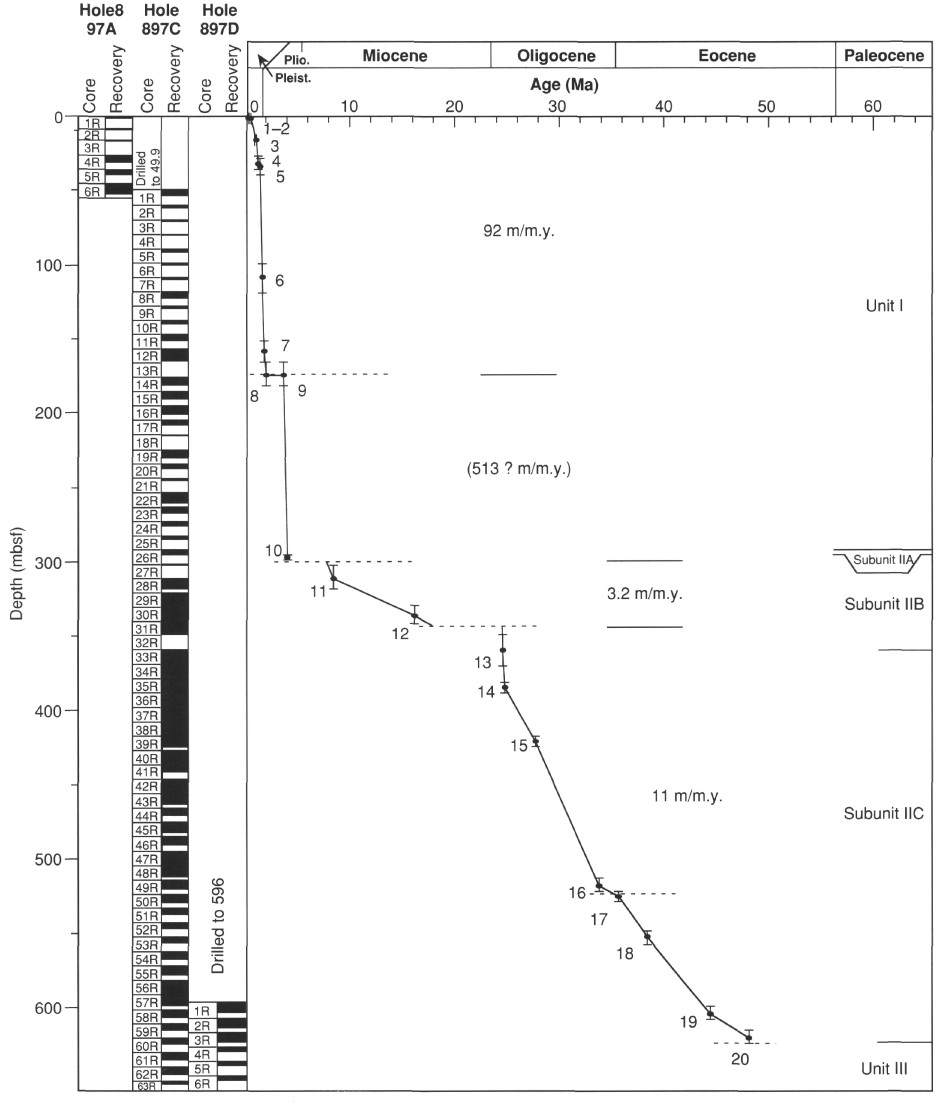
Figure 10. Depth vs. age curve for Site 897, combining nannofossil and foraminifer dates (see "Biostratigraphy" section, this chapter). Each data point is shown with depth and/or age error bars (numbers refer to datums in Table 5). The dashed horizontal lines are unconformities. The horizontal lines are major lithostratigraphic unit boundaries.