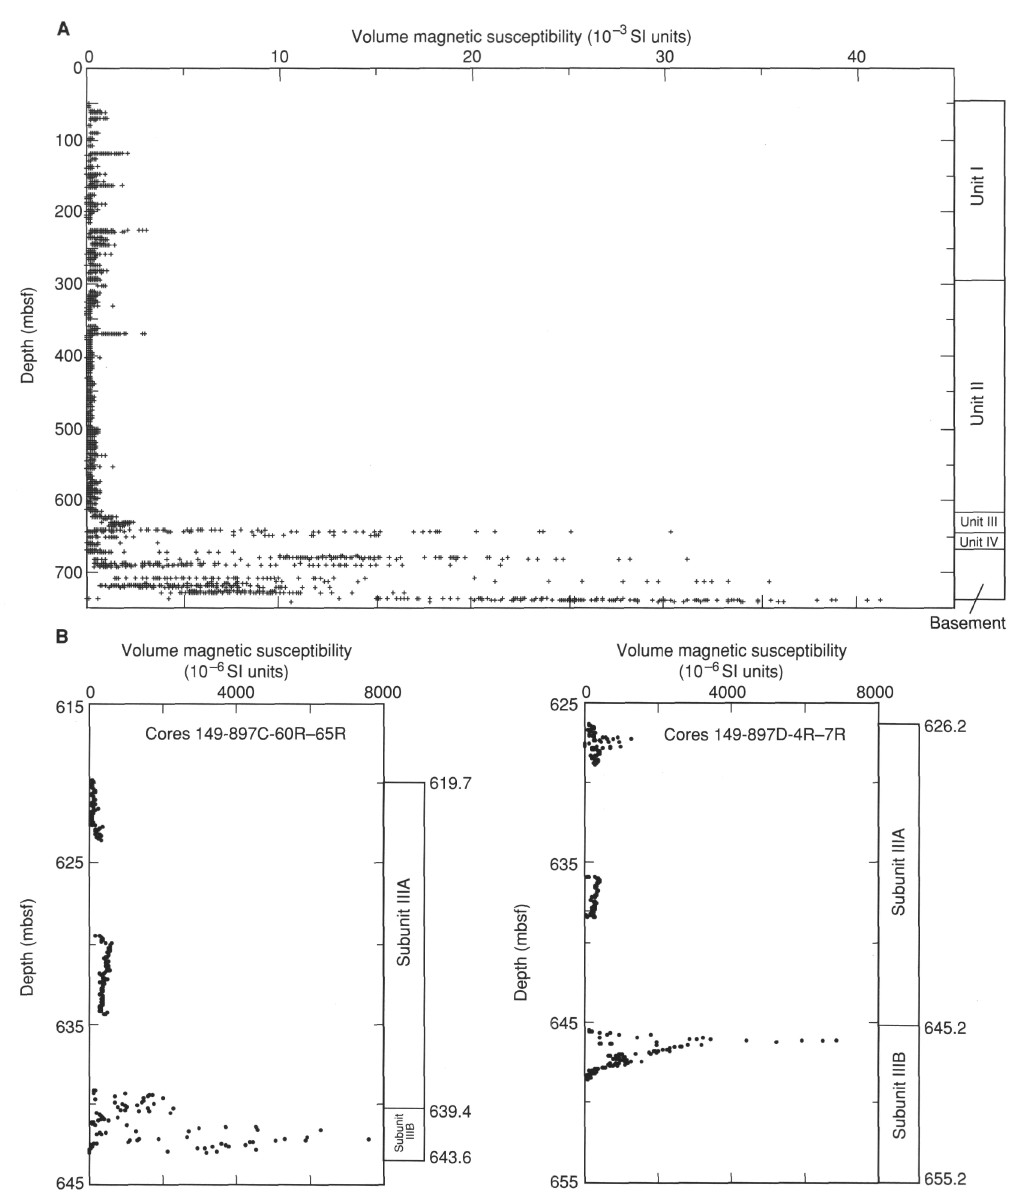
Figure 26.
A
. Plot of magnetic susceptibility as a function of sub-bottom depth from Hole 897C.
B
. Susceptibility variations in Subunits IIIA and IIIB, within Holes 897C and 897D.