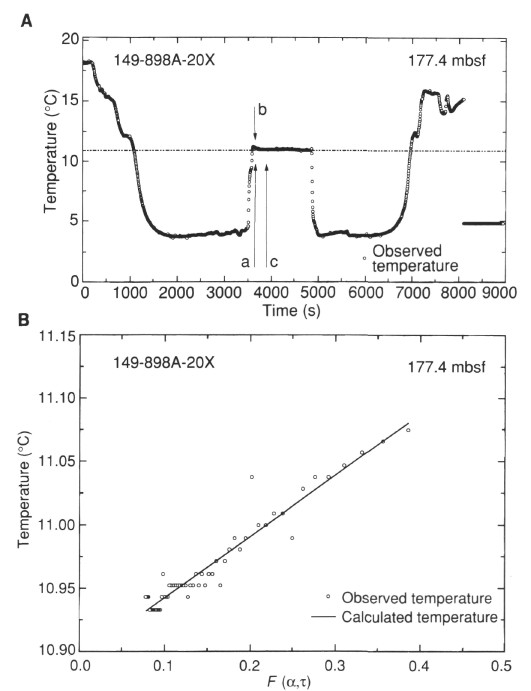
Figure 32. WSTP deployment at 177.4 mbsf in Hole 898A. A. Observed temperature as a function of time. The bottom-water temperature was interpreted as being 3.7° ± 0.1°C and the in-situ temperature as 10.9° ± 0.1°C. The insertion time used for curve fitting is indicated by arrow a. The portion of the temperature data used in the extrapolation is between arrows b and c. B. Observed temperature plotted vs. Bullard's "F" function (Bullard, 1954). The quality of the temperature extrapolation is reflected in the linearity of the plotted points.