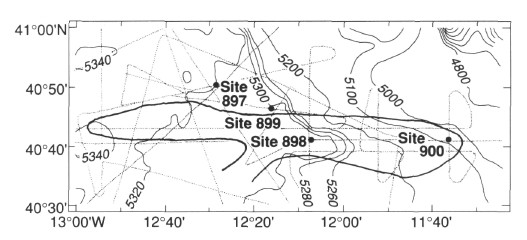
Figure 4. The distribution of the inclined reflector sequence in the vicinity of Leg 149 sites. Light lines are the seismic coverage on which the map is based. Fine dark lines are bathymetric contours. Bold line outlines the area in which the inclined reflector sequence was observed.