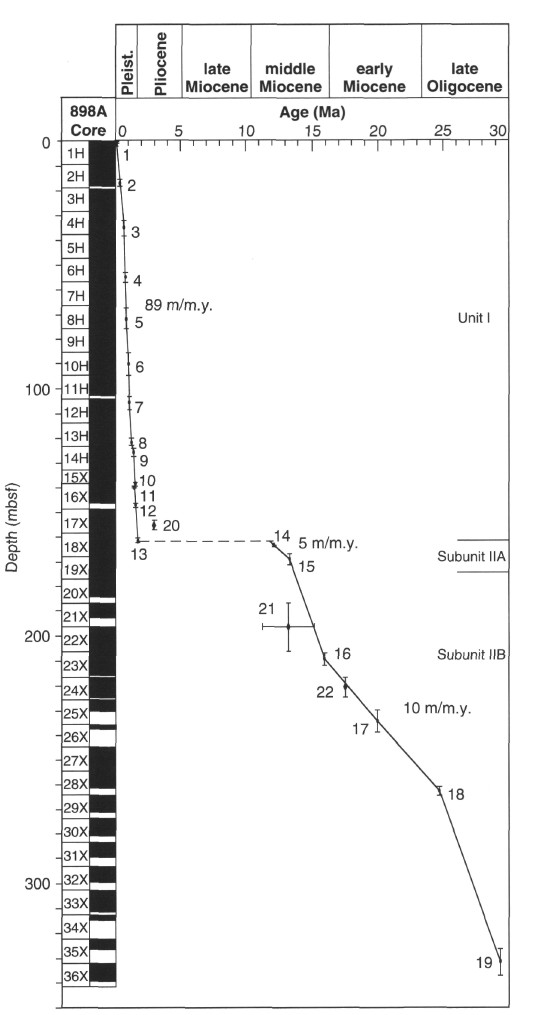
Figure 8. Depth vs. age curve for Site 898, plotted from data in Table 4 (see "Biostratigraphy" section, this chapter). Each data point is shown with depth and/or age error bars. Horizontal line is an unconformity. Light horizontal lines are major lithostratigraphic unit boundaries. Slopes of lines connecting adjacent data points are accumulation rates for that time or depth interval. Note that accumulation rates of lithostratigraphic Unit II are substantially lower than those of Unit I. Numbers refer to cores in Table 4.