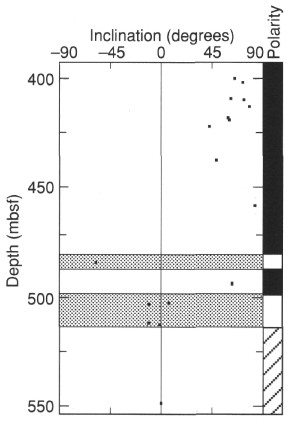
Figure 31. Plot of magnetic inclinations of thermally demagnetized discrete samples as a function of sub-bottom depth from 400 to 550 mbsf in Hole 899B. Gray areas outline reversed polarity intervals. The tentative interpretation of the polarity is shown on the right; zones in black (white) correspond to normal (reversed) polarity; cross-hachured zones represent uncertain polarity intervals.