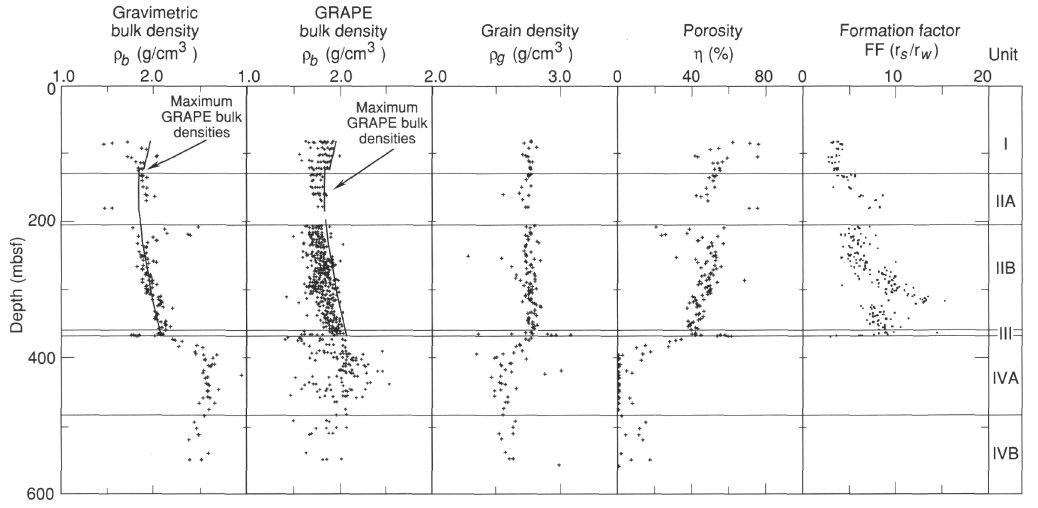
Figure 52. Gravimetrically determined and GRAPE-estimated bulk densities, grain density, porosity, and formation factor measurements in cores from Holes 899A and 899B. Electrical resistivity measurements in basement rocks are shown in
Figure 53. The lines on the bulk density graphs are the visually determined maximum GRAPE bulk density.