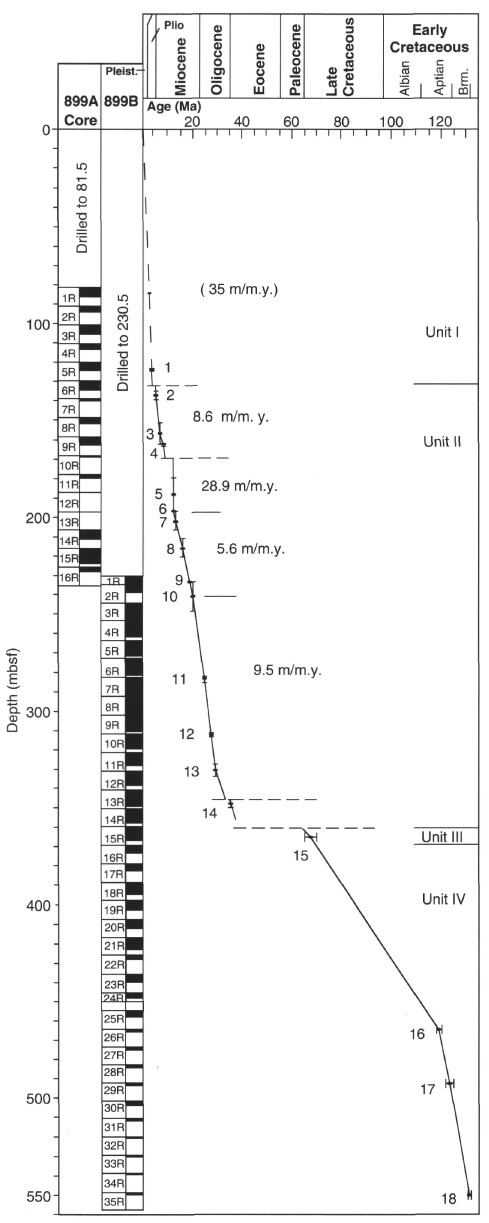
Figure 6. Curve of ages vs. depths for Site 899, plotted from data in Table 3. Each data point is shown with depth error bars. Bold horizontal lines are unconformities. Light horizontal lines are major lithostratigraphic unit boundaries. Slopes of lines connecting adjacent data points are sediment accumulation rates for that time or depth interval. Note that sediment accumulation rates of lithostratigraphic Unit II are substantially lower than those of Unit I.