![]()
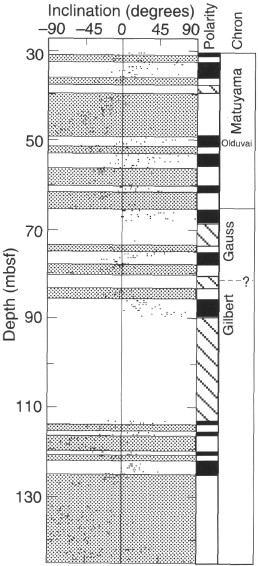
Figure 18. Plot of magnetic inclinations for Cores 149-900A-5R to -17R (after AF demagnetization at 15 mT). Gray shaded areas outline reversed polarity intervals. The tentative interpretation of the polarity, aided by biostratigraphic dates, is shown at right; zones in black (white) correspond to normal (reversed) polarity; hachured zones represent uncertain polarity intervals.
![]()