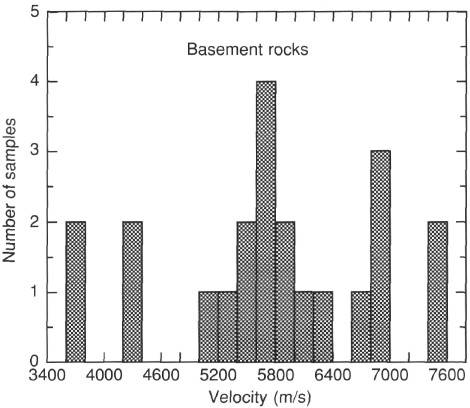
Figure 43. Histogram illustrating distribution of acoustic velocities measured in basement rocks from Hole 900A.