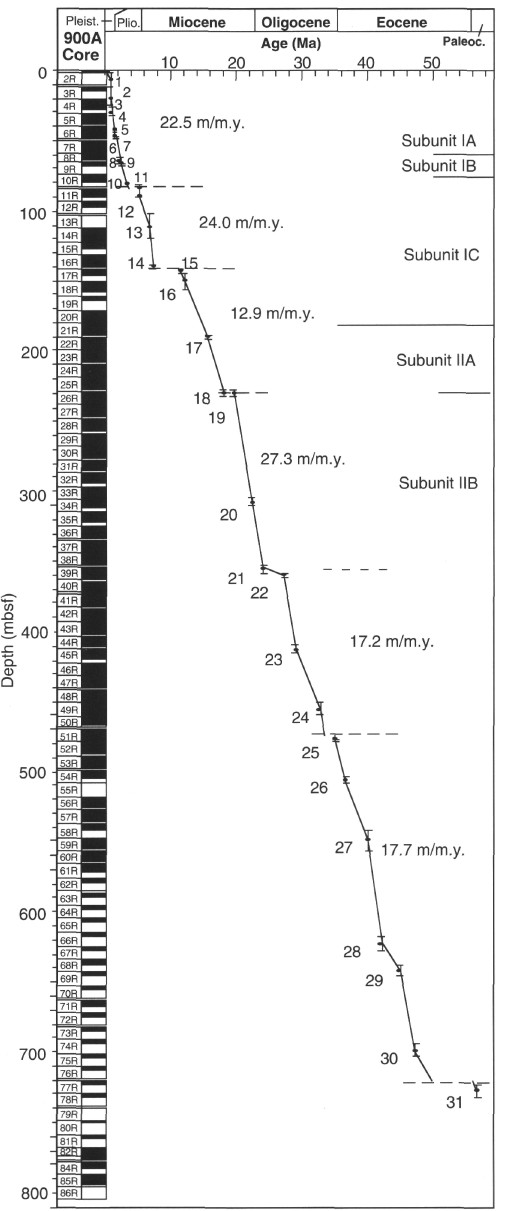
Figure 6. Depth
vs. age curve for Site 900, plotted from data in
Table 5 (see
"Biostratigraphy" section, this
chapter). Each data point is shown with a depth
error bar. Dashed horizontal
lines indicate hiatuses or condensed sections. Continuous horizontal lines are lithostratigraphic unit boundaries.
Slopes of lines
connecting adjacent data points are sediment accumulation rates for that
time
or depth interval. In contrast to Sites 897, 898, and 899, no significant
difference was seen between the sediment
accumulation rates for Units I and II.