![]()
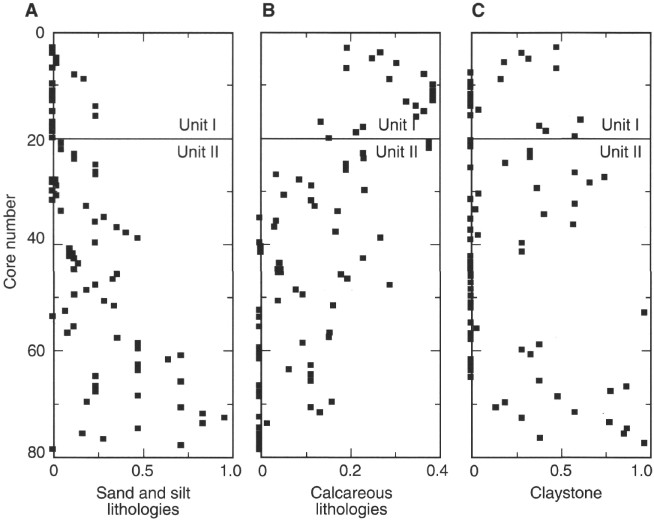
Figure 8. Plots of sand and silt lithologies (A), calcareous lithologies (B), and claystone lithologies (C) vs. depth. Lithologies are plotted as a fraction of the total lithologic assemblage present in each core. Calcareous lithologies include nannofossil oozes and chalks and nannofossil clays and claystones. Sand and silt lithologies include siltstone and sandstone and their unlithified equivalents. Depth trends for these various lithologies show that compositional variations through Unit II are gradational.
![]()