![]()
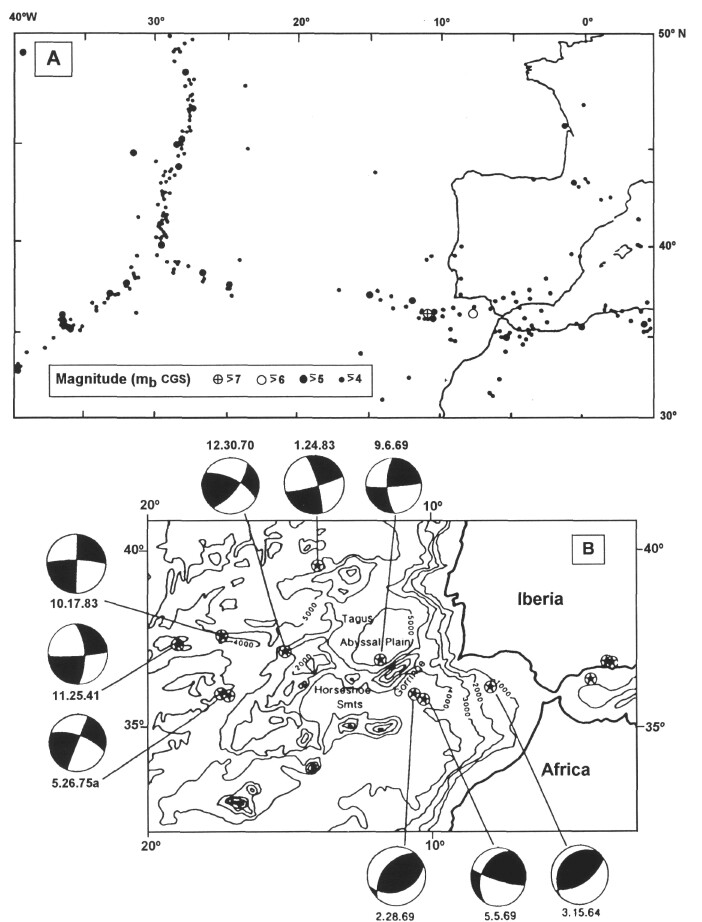
Figure 2. A. Seismicity map for the area between the Azores triple junction and the western Mediterranean for the period 1962-1972, showing location of epicenters of events with body-wave magnitude
![]() 4. From Udias et al. (1976). B. Earthquake focal mechanisms in the area of the eastern end of the Azores-Gibraltar plate
boundary (after Grimison and Chen, 1988). Bathymetry in meters. A mixture of strike-slip and thrust faulting characterizes the area. C. Simplified
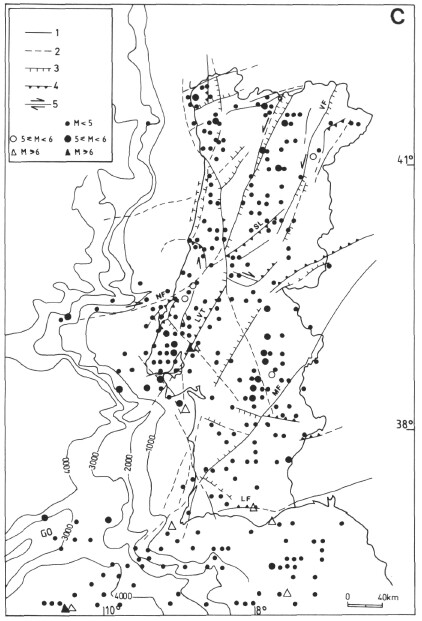
neotectonic map of Portugal (after Cabral, 1989) showing the main active structures and the magnitudes and epicentral location of the main historical and
present-day seismic activity (after Moreira, 1985). Open symbols denote historical events; solid symbols denote present-day instrumental earthquakes. 1 =
active fault; 2 = suspected active fault trace; 3 = normal fault or indeterminate vertical movement component (barbs on downthrown side); 4 = reverse fault; 5 =
strike-slip fault. GO = Gorringe Bank; LF = Loulé Fault; LVT = Lower Valley of the Tagus Fault; MF = Messejana Fault; NF = Nazaré Fault; SL = Seia-Lousã
Fault; VF = Vilariça Fault. Simplified bathymetry in meters, after Lallemand et al., 1985).
4. From Udias et al. (1976). B. Earthquake focal mechanisms in the area of the eastern end of the Azores-Gibraltar plate
boundary (after Grimison and Chen, 1988). Bathymetry in meters. A mixture of strike-slip and thrust faulting characterizes the area. C. Simplified
neotectonic map of Portugal (after Cabral, 1989) showing the main active structures and the magnitudes and epicentral location of the main historical and
present-day seismic activity (after Moreira, 1985). Open symbols denote historical events; solid symbols denote present-day instrumental earthquakes. 1 =
active fault; 2 = suspected active fault trace; 3 = normal fault or indeterminate vertical movement component (barbs on downthrown side); 4 = reverse fault; 5 =
strike-slip fault. GO = Gorringe Bank; LF = Loulé Fault; LVT = Lower Valley of the Tagus Fault; MF = Messejana Fault; NF = Nazaré Fault; SL = Seia-Lousã
Fault; VF = Vilariça Fault. Simplified bathymetry in meters, after Lallemand et al., 1985).
![]()