![]()
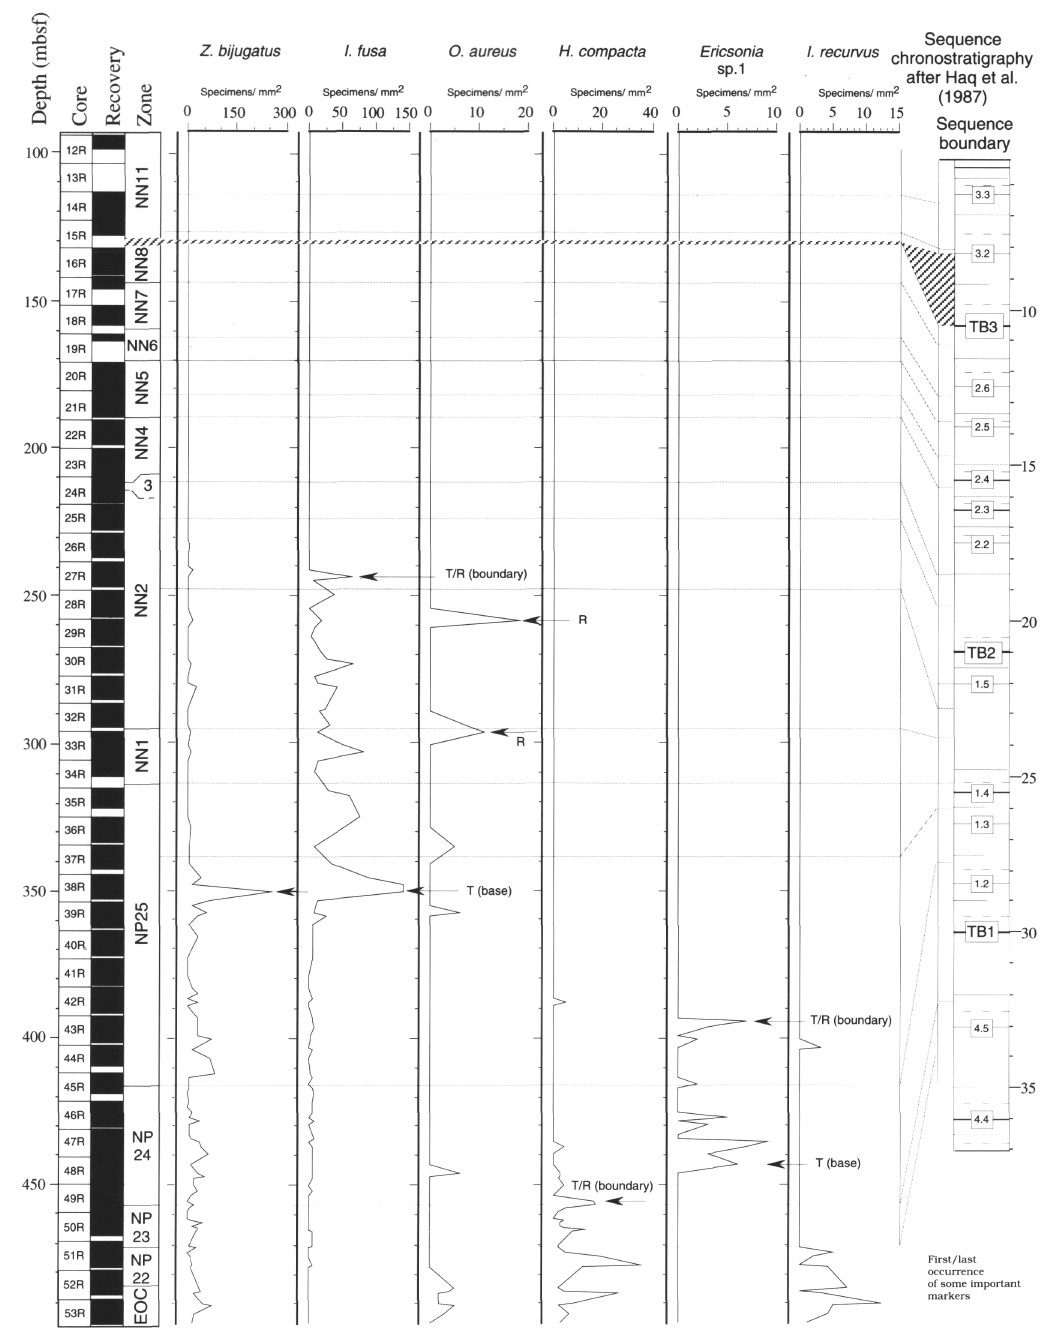
Figure 10. Correlations in Hole 900A of the abundance pattern for some holococcolith species and additional early Oligocene bioevents with the sequence chronostratigraphy of Haq et al. (1987). Horizontal lines represent the major bioevents. R = regressive; T = transgressive; T/R = maximum flooding surface.
![]()