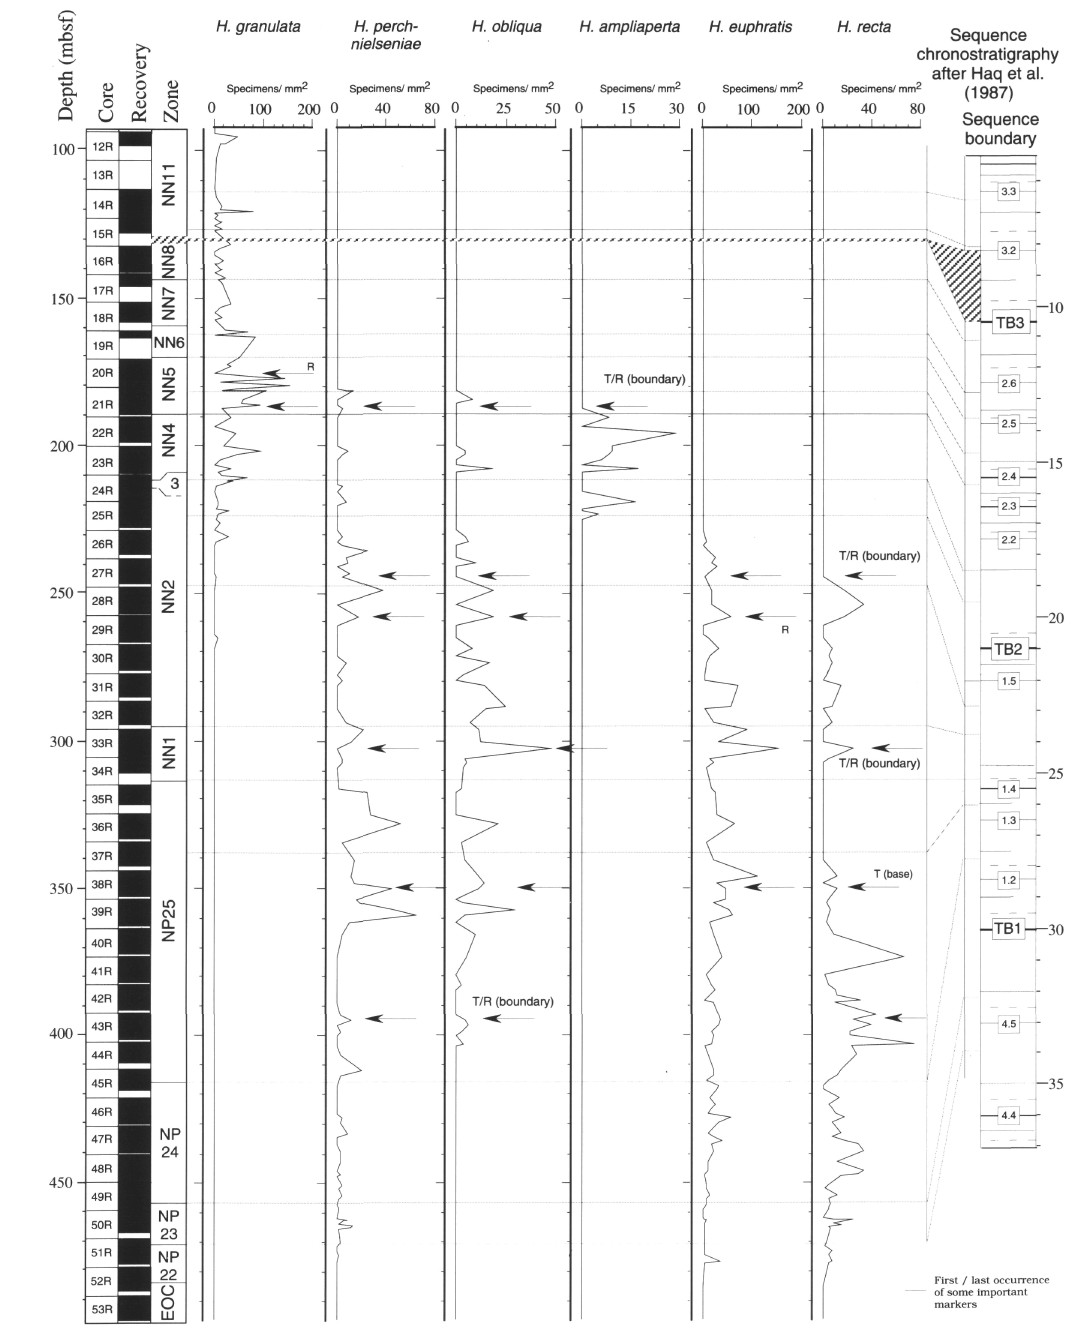
Figure 11. Correlations in Hole 900A of the abundance pattern of Helicosphaera species with the sequence chronostratigraphy of Haq et al. (1987). Horizontal lines represent the major bioevents. R = regressive; T = transgressive.