![]()
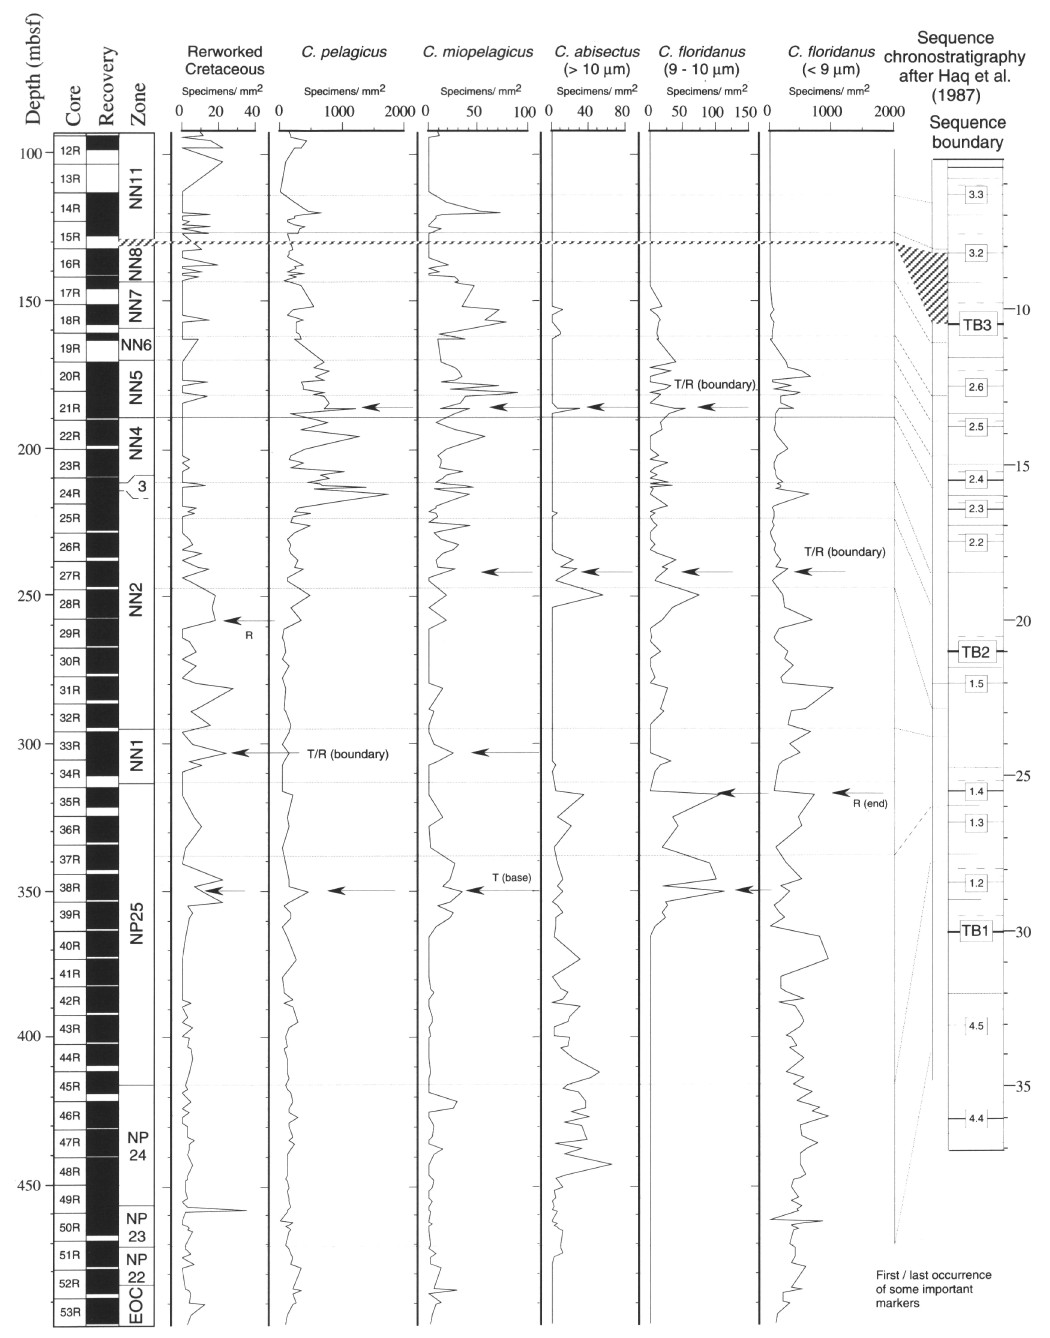
Figure 12. Correlations in Hole 900A of the abundance pattern of reworked Cretaceous, Coccolithus, and Cyclicargolithus species with the sequence chronostratigraphy of Haq et al. (1987). Horizontal lines represent the major bioevents (9 to 10 µm C. floridanus group is differentiated from Zone NP25). R = regressive; T = transgressive.
![]()