![]()
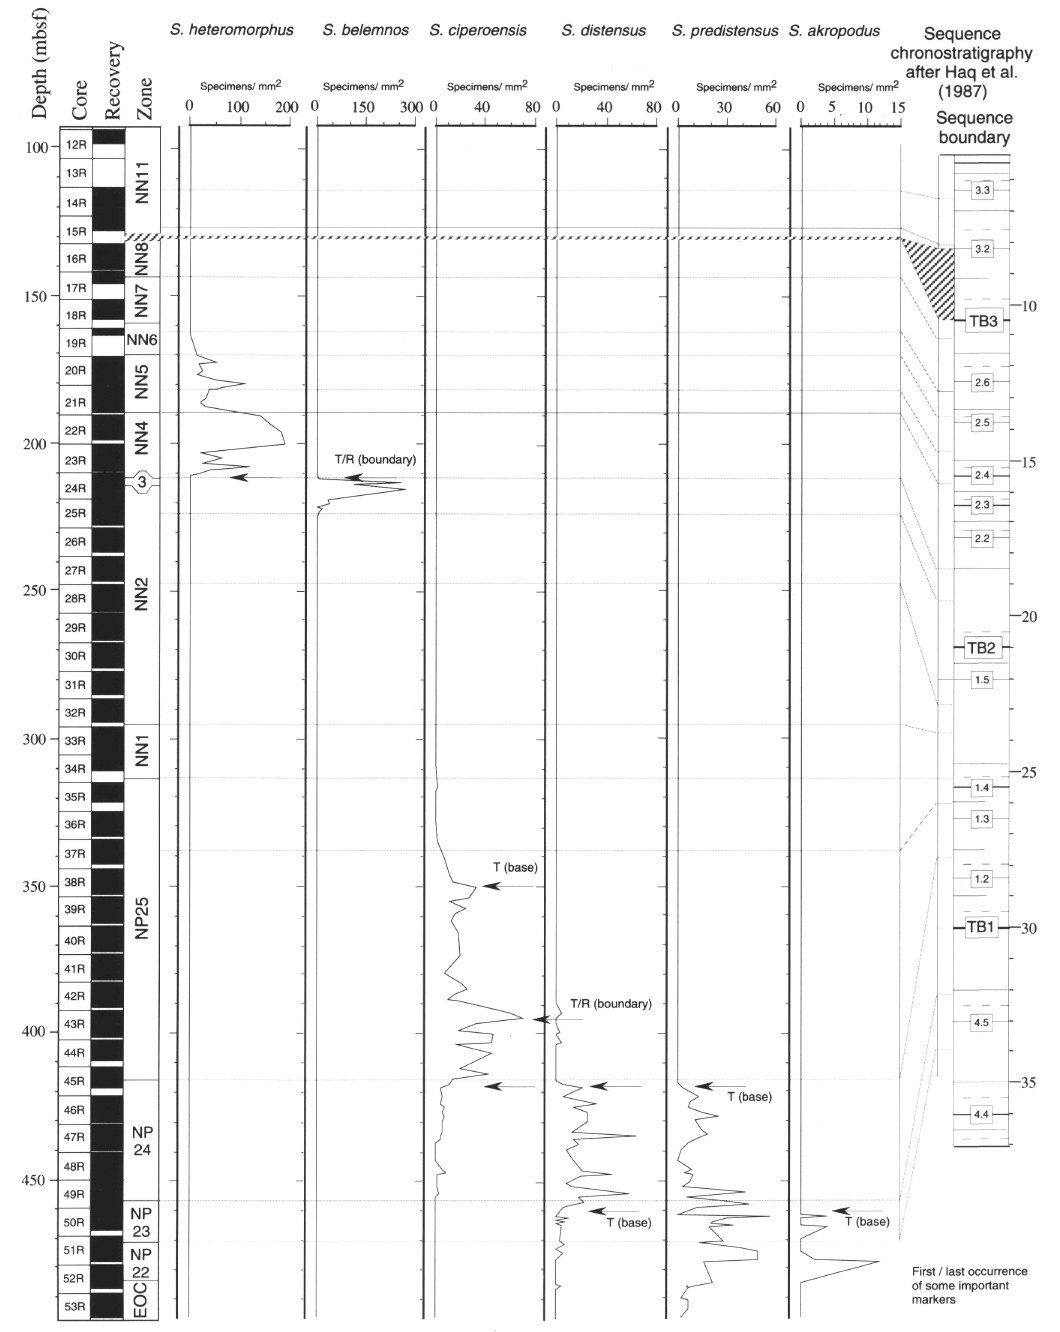
Figure 13. Correlations in Hole 900A of the abundance pattern of some Oligocene and Miocene Sphenolithus species with the sequence chronostratigraphy of Haq et al. (1987). Horizontal lines represent the major bioevents. R = regressive; T = transgressive.
![]()