![]()
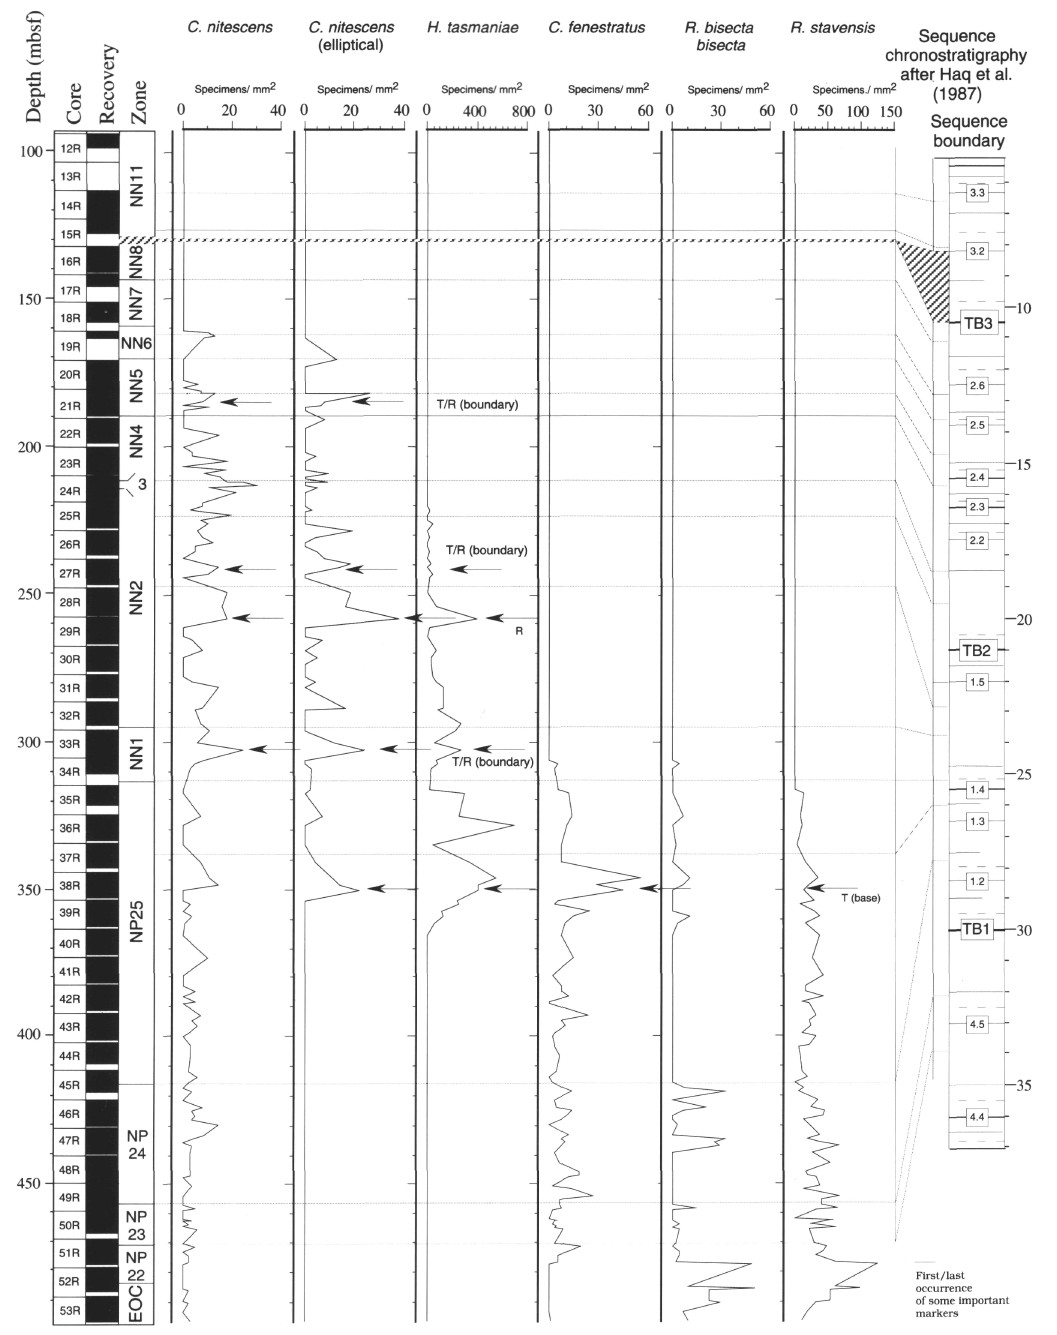
Figure 14. Correlations in Hole 900A of the abundance pattern of some important secondary markers across the Oligocene/Miocene boundary with the sequence chronostratigraphy of Haq et al. (1987). Horizontal lines represent the major bioevents. R = regressive; T = transgressive.
![]()