![]()
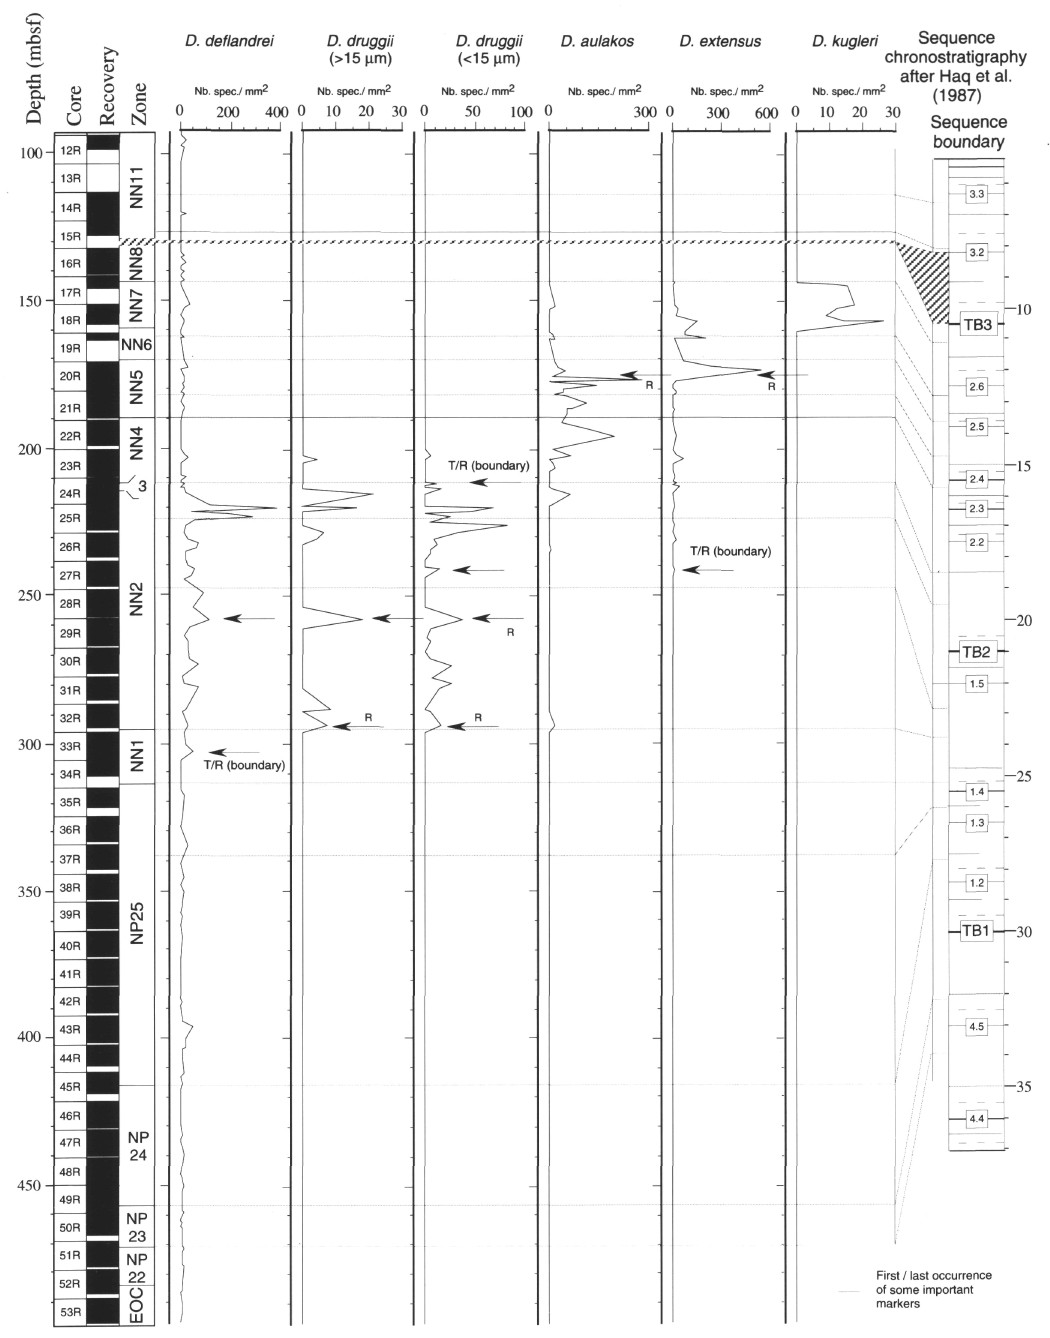
Figure 15. Correlations in Hole 900A of the abundance pattern of discoaster taxa (species with large central area) with the sequence chronostratigraphy of Haq et al. (1987). Horizontal lines represent the major bioevents. R = regressive; T = transgressive.
![]()