![]()
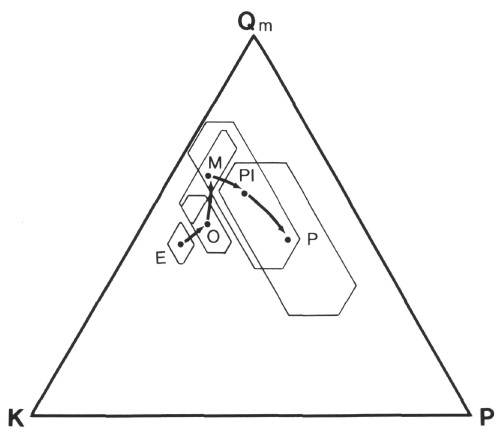
Figure 10. QmKP ternary plot of Cenozoic very fine sand detrital modes (see Table 2 for values). Polygons represent the fields of variation (standard deviations) about mean values for various epochs. Arrows connect progressively younger means and outline temporal shifts in composition. Abbreviations as in Figure 9.
![]()