![]()
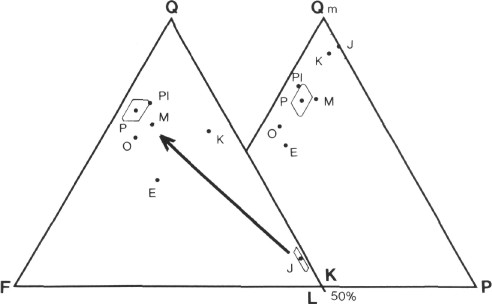
Figure 11. QFL (left) and QmKP (right) ternary plots of fine sand detrital modes. Means and fields of variation (polygons) are plotted for time intervals represented by multiple samples (Jurassic [J], n = 3; Pleistocene [P], n = 8), and individual samples are plotted for the remaining time intervals (K = Cretaceous; abbreviations as in Fig. 9). The arrow defines the general temporal trend.
![]()