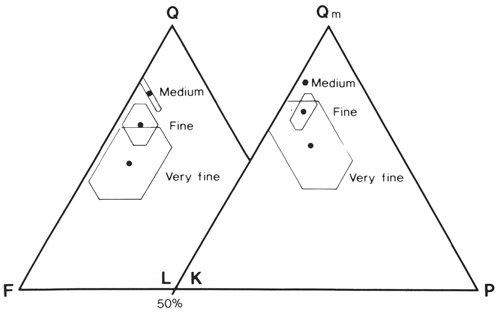
Figure 7. QFL (left) and QmKP (right) ternary plots of detrital modes for medium, fine, and very fine sand subsets for all Cenozoic samples. Polygons represent the fields of variation (standard deviations) about mean values.