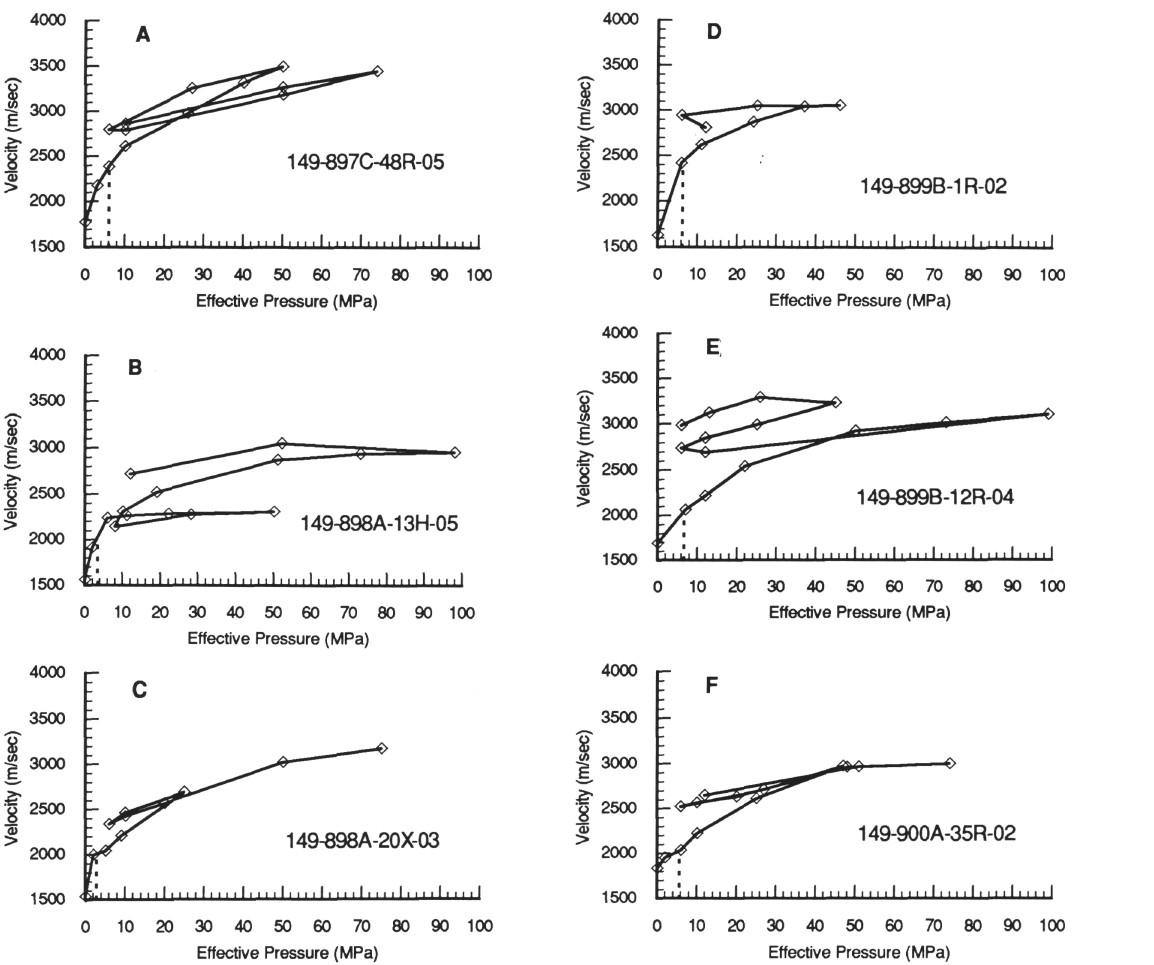
Figure 5. A-F. Corrected velocity curves for samples analyzed in this study. The vertical dashed line indicates the best estimate of the in situ effective pressure.