![]()
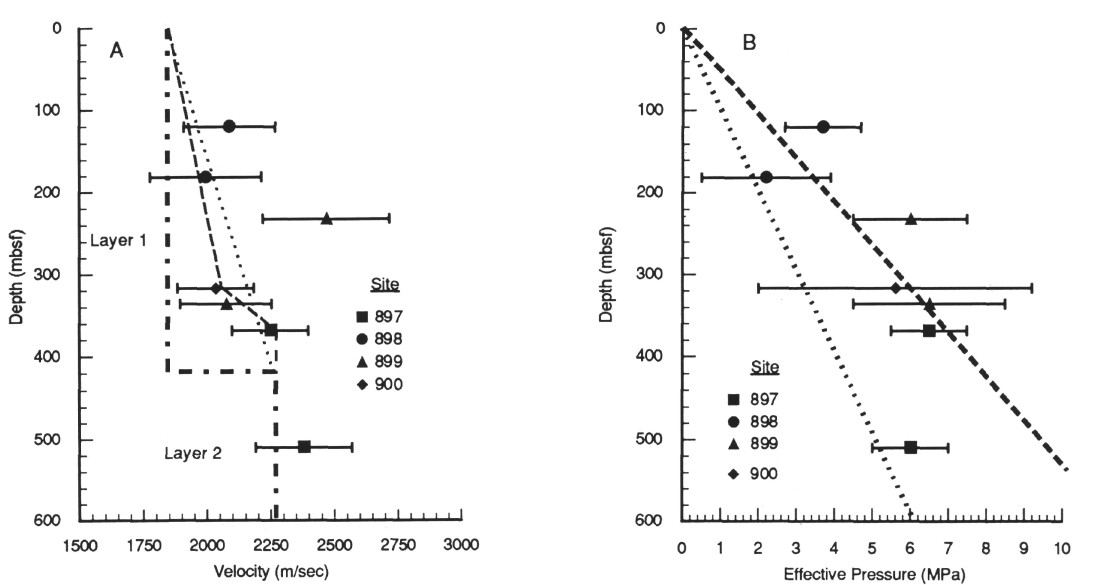
Figure 6. A. Estimated in situ velocity plotted as a function of depth of burial. The heavy dashed line is the velocity curve reported by Whitmarsh et al. (1990) for sonobuoy Line 1. Model 1 (dotted line) is a linear interpolation of the sonobuoy velocities between the seafloor and the top of acoustic Layer 2. Model 2 (dashed line) includes a moderate linear velocity gradient above 320 mbsf, and a steep velocity gradient between 320 and 370 mbsf. See text for discussion. B. Estimated in situ effective pressure plotted as a function of depth. Also shown are the hydrostatic pressure gradient (dotted line) and lithostatic pressure gradient (dashed line) assuming a constant density of 1.9 g/cm3 (Sawyer, Whitmarsh, Klaus, et al., 1994).
![]()