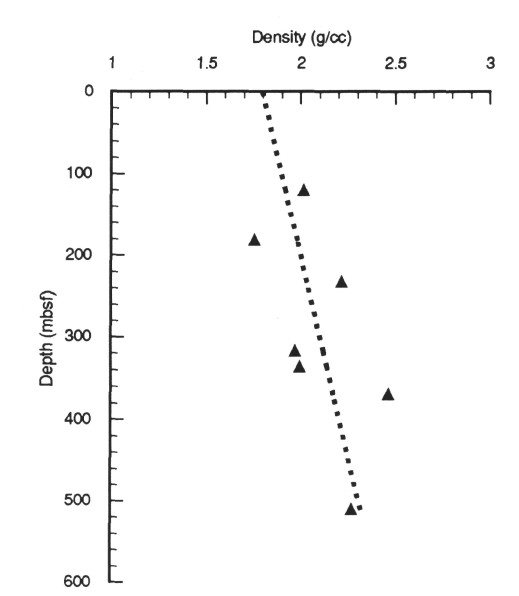
Figure 8. Estimated in situ density plotted as a function of depth (symbols). The best-fit linear trend is indicated by the dotted line.