![]()
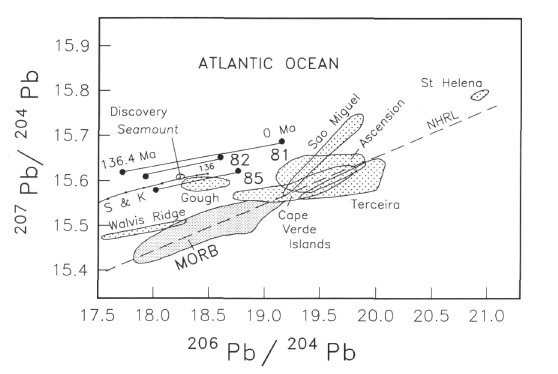
Figure 13. A 207Pb/204Pb vs. 206Pb/204Pb isotope diagram showing the relationship of the three Hole 900A samples relative to MORB and OIB from the Atlantic Ocean. Although the relatively high 207Pb/204Pb values of the Hole 900A samples might appear to allow an OIB origin, the very high
![]() Nd
(Fig. 12) undoubtedly point to a depleted mantle source. In addition, we have plotted both the measured Pb values and the age-corrected in situ decay values. The correction is unusually large because of the enrichment in U from seawater alteration. The real corrected values at 136.4 Ma for the Hole 900A rocks are most probably in between the measured and age-corrected values here plotted. The high 207Pb/204Pb values relative to recent Atlantic MORB probably reflect seawater alteration also. Correction for 136.4 Ma MORB would result in only a very small displacement toward the lower left corner. The two-stage lead isotope curve of Stacey and Kramers (1975) is shown by the line labeled S & K and marked with dots 100 Ma apart; except for the farthest-right dot, which represents 136 Ma. The dot immediately to its left is at 200 Ma. The far-left dot on the S & K curve is at 700 Ma. This curve represents the average evolution curve for continental crust. The Hole 900A rocks, at 136.4 Ma, are distinctly less radioactive than corresponding continental crust of that age, which confirms the oceanic origin of these rocks. Isotopic data for Atlantic Ocean MORB and OIB were obtained from Cohen and
O'Nions, 1982; Gerlach et al., 1987; Hamelin et al., 1984; Richardson et al., 1982; Sun, 1980; Weis, 1983; and Zindler et al., 1982.
Nd
(Fig. 12) undoubtedly point to a depleted mantle source. In addition, we have plotted both the measured Pb values and the age-corrected in situ decay values. The correction is unusually large because of the enrichment in U from seawater alteration. The real corrected values at 136.4 Ma for the Hole 900A rocks are most probably in between the measured and age-corrected values here plotted. The high 207Pb/204Pb values relative to recent Atlantic MORB probably reflect seawater alteration also. Correction for 136.4 Ma MORB would result in only a very small displacement toward the lower left corner. The two-stage lead isotope curve of Stacey and Kramers (1975) is shown by the line labeled S & K and marked with dots 100 Ma apart; except for the farthest-right dot, which represents 136 Ma. The dot immediately to its left is at 200 Ma. The far-left dot on the S & K curve is at 700 Ma. This curve represents the average evolution curve for continental crust. The Hole 900A rocks, at 136.4 Ma, are distinctly less radioactive than corresponding continental crust of that age, which confirms the oceanic origin of these rocks. Isotopic data for Atlantic Ocean MORB and OIB were obtained from Cohen and
O'Nions, 1982; Gerlach et al., 1987; Hamelin et al., 1984; Richardson et al., 1982; Sun, 1980; Weis, 1983; and Zindler et al., 1982.
![]()