![]()
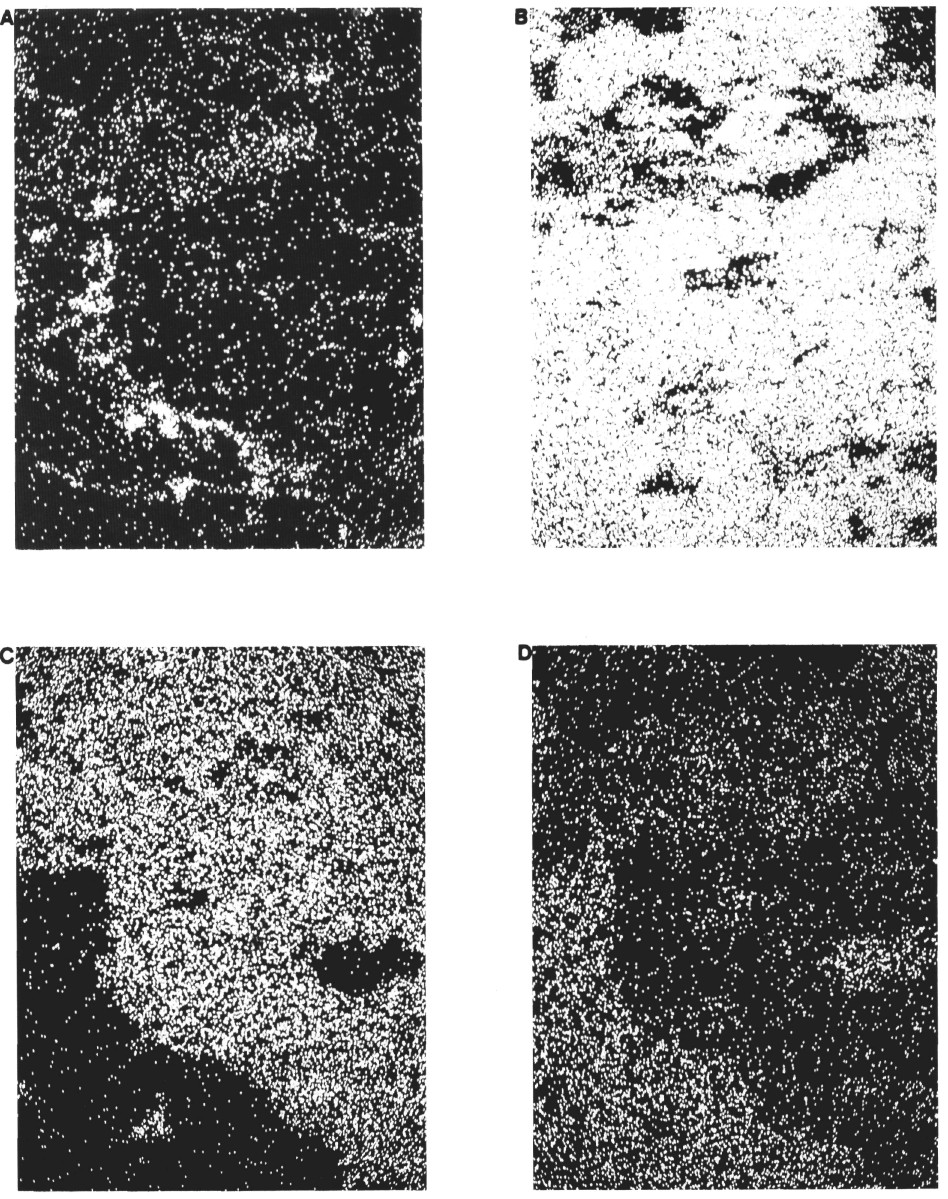
Figure 15. Microprobe elemental maps of a patchy grain boundary alteration band between recrystallized plagioclase and clinopyroxene in Sample 149-900A-83R-2, 60-65 cm. The photos have a long dimension of roughly 160 µm and increasing brightness marks increasing concentrations. A. The K concentration is patchy and does not correlate well with the concentration of any other analyzed element. B. The Ca concentration is high in both plagioclase and clinopyroxene and slightly lower in the irregular K-rich region. C. The Mg concentration, and a similar Fe concentration, marks the position of a clinopyroxene crystal. D. The Al concentration marks the position of a plagioclase crystal.
![]()