![]()
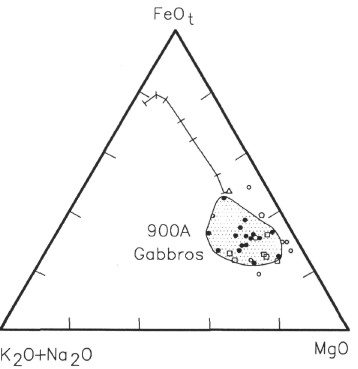
Figure 16. When the metamorphosed mafic rocks (solid circles) are plotted on an AFM diagram, they fall below the M (MgO) end of the Skaergaard trend (crossed line) in a region characterized by cumulate gabbros. Cumulate gabbros from a variety of tectonic provinces are plotted for comparison: open circles = cumulate gabbros from ophiolites (Beccaluva et al., 1977; Phelps and Avé Lallemant, 1980; and Jaques and Chappell, 1980); squares = cumulate gabbros from the Southwest Indian Ridge (Meyer et al., 1989); pentagon = cumulate gabbro from the Mid-Atlantic Ridge (Tiezzi and Scott, 1980); triangle = N-MORB (Humphris et al., 1985). The Hole 900A sample, which plots separately at the top of the field near N-MORB, is Sample 149-900A-81R-1, 96-101 cm; it contains opaque minerals and higher concentrations of incompatible elements.
![]()