![]()
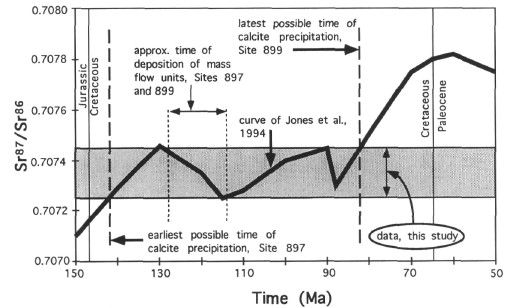
Figure 5. Comparison of Sr isotopic values in fracture-filling calcites to Sr isotopic variations in Cretaceous seawater. 87Sr/86Sr values observed in vein-filling calcites at Sites 897 and 899 (here corrected by -0.0001 from measured values) fall within the shaded area. The line showing the approximate 87Sr/86Sr variation in seawater is generalized from the curve of Jones et al. (1994, figs. 3, 4). The timing of mass-flow deposition is constrained by biostratigraphic data (Shipboard Scientific Party, 1994a, 1994b). See text for discussion.
![]()