![]()
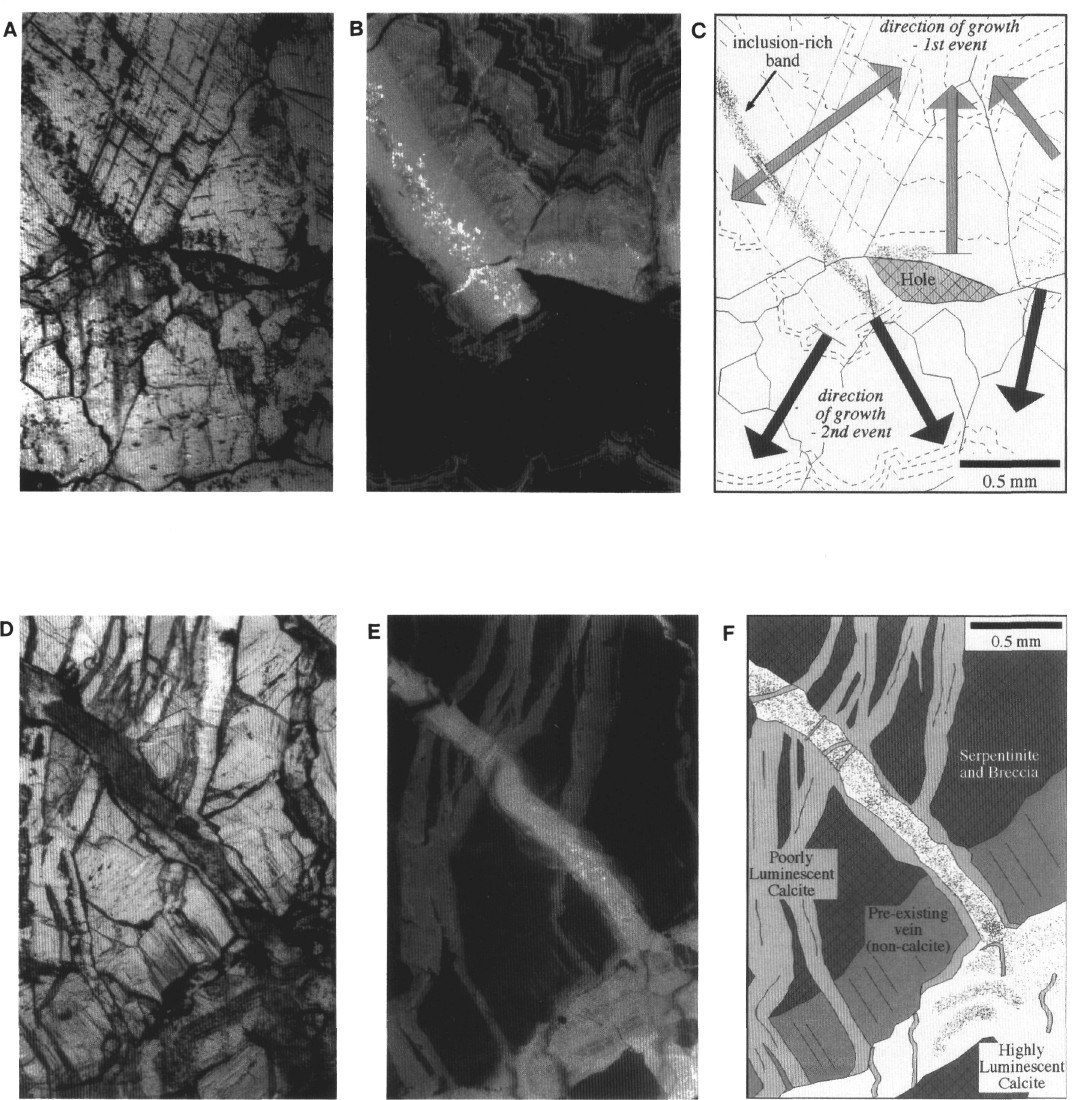
Figure 10. Crack-seal textures in calcite veins. A. Plane-polarized light photomicrograph of Sample 149-899B-18R-5, 58-62 cm, showing coarse, blocky crystals with different optical orientations (note cleavage planes). Grain boundaries stand out in relief, and a narrow, inclusion-rich band is observed to transect the boundaries. B. Cathodoluminescence photomicrograph of same view showing the distinct truncation of a highly luminescent band of calcite cored by the inclusion-rich band, and a contrast in luminescence on either side of the band. C. Interpretive sketch of same view. Two episodes of calcite precipitation are suggested. The first event, symmetric about the inclusion-rich band, produced highly luminescent, zoned calcite (gray arrows); a second, postfracture, event led to syntaxial growth of poorly luminescent, finely zoned calcite (black arrows). See Figure 6 caption for explanation of symbols. D. Plane-polarized light photomicrograph of Sample 149-899B-19R-2, 111-114 cm, showing complicated crosscutting relationships among different vein generations. The large vacuolized vein at the lower right corner appears continuous with a vein with a vacuolized core that transects the image, and appears to crosscut clear, vertical veins. E. Cathodoluminescence photomicrograph demonstrates greater complexity; the less luminescent, vertical veins appear to overprint the apparently later, more luminescent vacuolized veins. This apparent contradiction may arise from multiple, alternating vein-generating events. F. Interpretive sketch of same view.
![]()