![]()
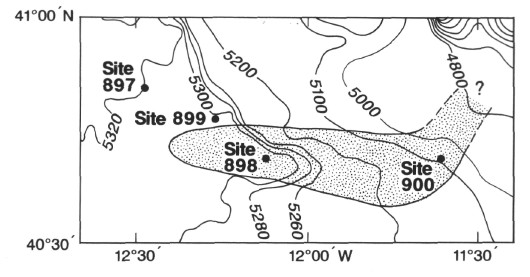
Figure 6. Map showing the distribution of the inclined reflection sequence in the vicinity of the Leg 149 sites. Light lines are the seismic coverage on which the map is based. Fine lines are bathymetric contours. Bold line outlines the area in which the inclined reflection sequence was observed. Modified from figure 4 of Shipboard Scientific Party (1994b).
![]()