![]()
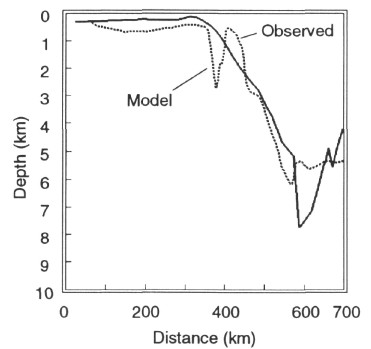
Figure 15. Elevation profile of the surface of the model at time 130 Ma (+100 Ma; the last executed step) plotted beside the observed sediment-stripped depth-to-basement. The left side represents Newfoundland, and the right side represents the Iberian Margin. The point of greatest necking appears at about 600 km in this figure. The x-axis values are arbitrary and are meant only to indicate horizontal scale.
![]()