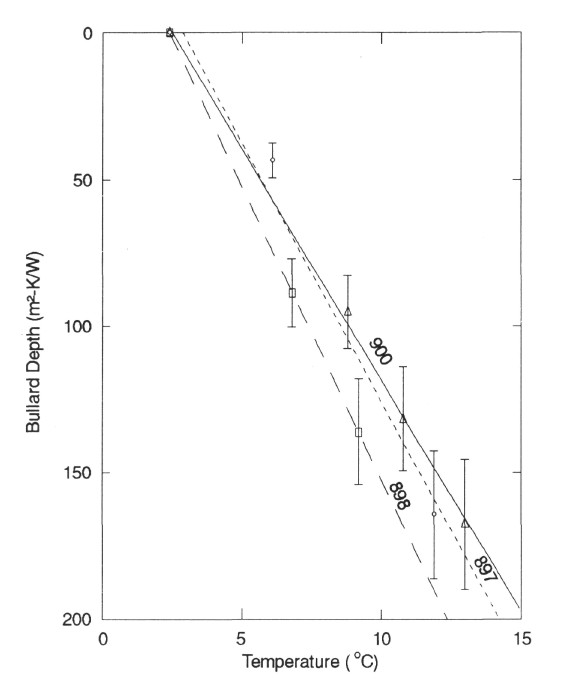
Figure 5. Measurements of thermal conductivity on sediment samples as indicated from Sites 897, 898, 899, and 900 (Sawyer, Whitmarsh, Klaus, et al., 1995). Linear least-squares regression
( 1
1 )
lines are shown for fits to the data, where z < 640 m, excluding the anomalously high values enclosed by the dotted line.
)
lines are shown for fits to the data, where z < 640 m, excluding the anomalously high values enclosed by the dotted line.