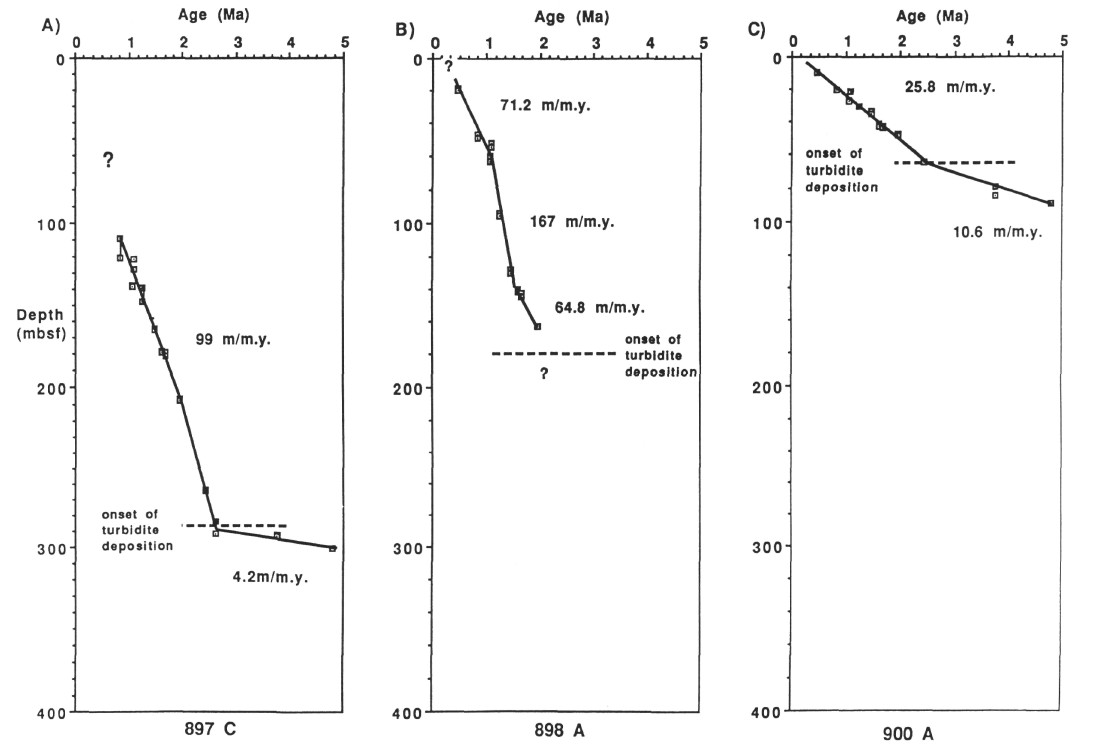
Figure 16. Variations in rates of total sediment accumulation through time and across the margin. A. Age vs. depth plot of total sediment accumulation at Hole 897C. B. Age vs. depth plot of total sediment accumulation at Hole 898A. C. Age vs. depth plot of total sediment accumulation at Hole 900A (from
Milkert et al., this volume).