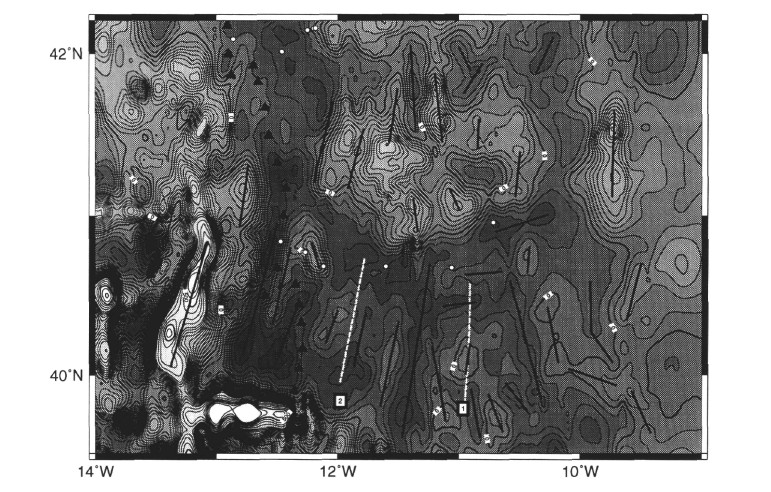
Figure 10. Reduced-to-the-pole magnetic anomaly chart of west Iberia (25 nT contours between +300 and -300 nT, otherwise 50 nT) from Miles et al., this volume. Magnetic highs/lows are light gray/dark gray, respectively. Shading scheme and contours have been chosen to emphasize the smaller amplitude anomalies. Thick lines = principal linear features. White dots = DSDP/ODP sites. Triangles = predicted basement peridotite ridge (Beslier et al., 1993). White lines = seismic refraction lines of Whitmarsh et al. (1990). From Whitmarsh and Miles (1995).