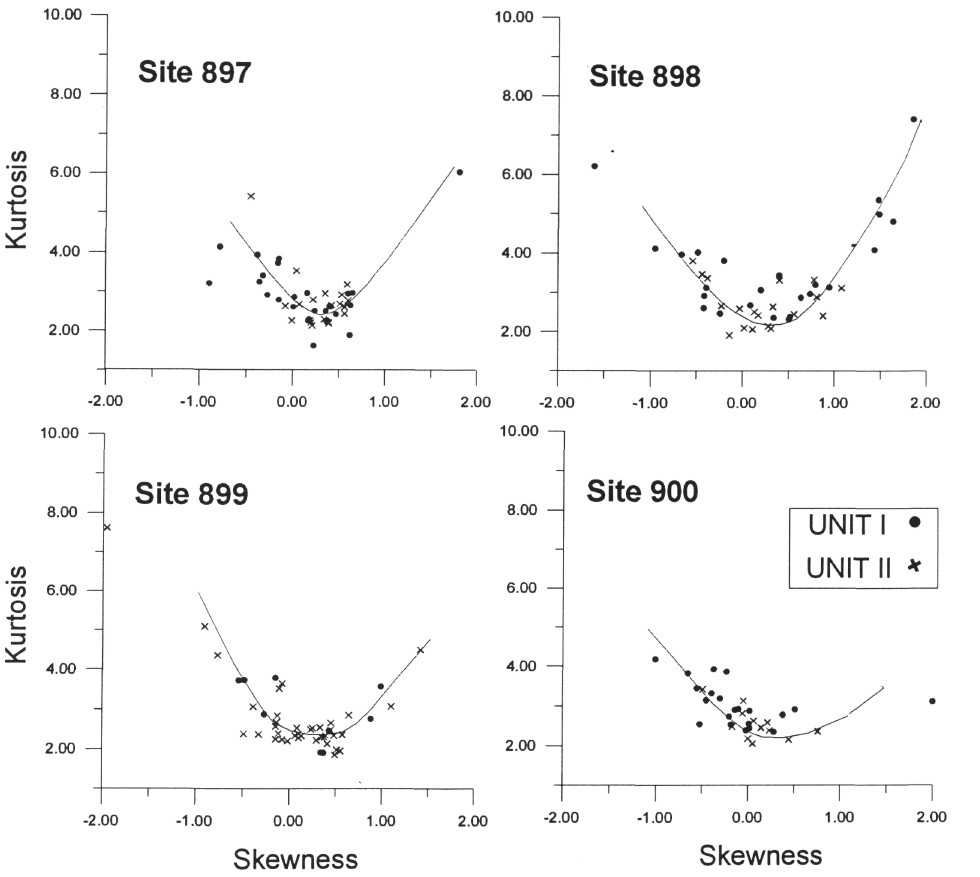
Figure 3.
Binary plots of kurtosis vs. skewness for samples from Units I and II (Sites 897, 988, 899, and 900) in the Iberia Abyssal Plain.