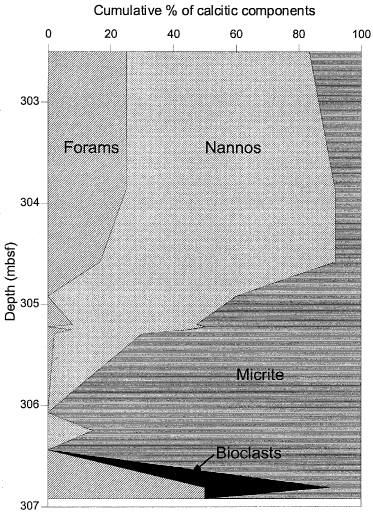
Figure 11.
Depth variations in the relative abundances of calcitic components identified in smear slides for Unit II and the base of Unit I from Hole 975B, expressed in terms of cumulative area percent (data from Comas, Zahn, Klaus, et al., 1996).