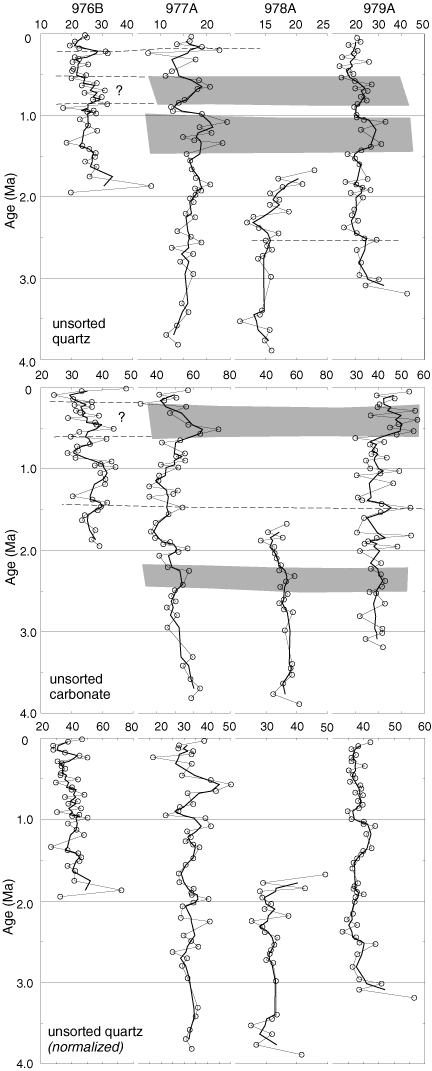
Figure 10. Between-hole correlation of quartz (top), carbonate (middle), and carbonate-normalized quartz (bottom) for unsorted samples. Thin downhole lines and symbols represent actual data; thick lines are three-point moving averages. Correlations discussed in text are shown by shading; ? = tentative correlation.


![]()