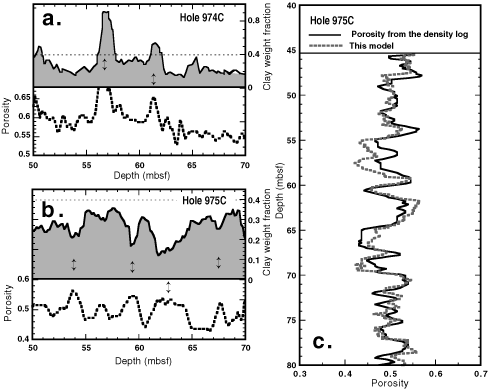
Figure 6. Selected portions of the porosity for Holes 974C (A) and 975C (B) are illustrated. Porosity is derived from the density log, and shale content is derived from the gamma-ray log. For shale content > 0.394, the model predicts that porosity and shale content are positively correlated. For shale content <0.39, the model predicts that porosity and shale content are anticorrelated. Such correlations are observed in the diagrams (as indicated by small arrows) depending on shale content. C. The porosity can be predicted as a function of depth as the combination of two effects: (1) a high-amplitude variation, which reflects the compaction and the effects of fluid overpressure, and (2) small-scale variations caused by lithologic variations related to variations of the clay content.


![]()