
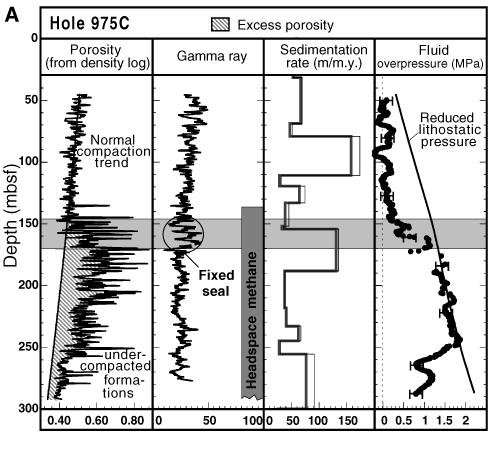
Figure 7. A. Porosity analysis from Hole 975C. The porosity derived from the density log decreases almost linearly with depth of burial from seafloor to 120-145 mbsf. Such a decrease is characteristic of equilibrium compaction, and the normal compaction trend is indicated by the plain (almost linear) curve ( 0 = 0.53,
  = 1.41 x 10⁻⁷ Pa-1). Between 145 and 170 mbsf, there is an apparent increase of the porosity with depth and, below this depth, the porosity is higher than predicted by the (hydrostatic) normal trend of compaction. This anomalous porosity (dashed zone) is not caused by lithologic variations because the gamma-ray log, an indicator of a shale content, is fairly constant. It is interpreted as the result of fluid overpressure: the porosity in the formations between 145 to 250 mbsf has been "frozen" at shallower depths because of the presence of a sealing mechanism (a "fixed seal"), probably related to the presence of gas, which is indicated by the high-frequency variations in the porosity curve below 140 mbsf (see main text). Fluid overpressure (fluid pressure above hydrostatic) is estimated from the difference between the porosity predicted by the normal compaction trend and the porosity derived from the density log. The lithostatic pressure is derived by numerical integration of the density log. The reduced lithostatic pressure is defined as the lithostatic pressure minus the hydrostatic pressure. Below the seal, the fluid overpressure is observed to be close to the reduced lithostatic pressure, which indicates the presence of natural fracturing in the transition zone.
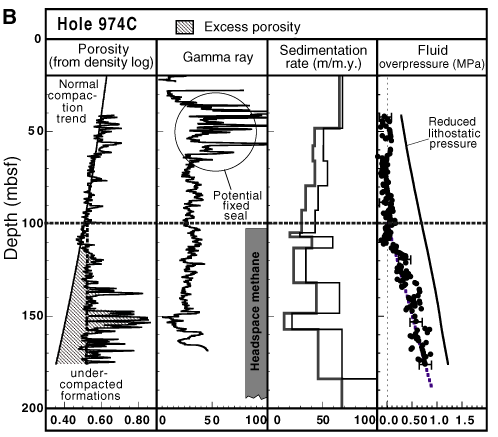
B. A porosity analysis of Hole 974C is illustrated. The porosity derived
from the density log decreases almost linearly with depth of burial from 40 mbsf
until reaching a transition zone at 100 mbsf. Such a decrease is characteristic
of equilibrium compaction and the normal compaction trend is indicated by the
solid (almost linear) curve (
 0
= 0.66,
  = 3.35 x 10⁻⁷
Pa-1). Below 100 mbsf, the porosity remains constant with depth. The
high-frequency porosity variations below 120 mbsf are artificial and result from
the presence of gas that has not been accounted for when porosity was derived
from the density log. The constant porosity trend below 100 mbsf is
characteristic of a migrating seal: the top of the undercompacted domain is not
fixed in a framework attached to the sediments, but is fixed in a framework
attached to the seafloor (A. Revil and L. Cathles, unpubl. data). Fluid
overpressure is estimated from the excess porosity. Below 110 mbsf, fluid
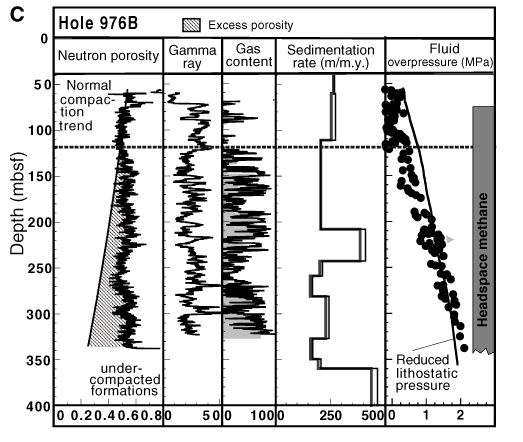
overpressure increases linearly with depth. C. A porosity analysis of
Hole 976B is illustrated. From 60 to 120 mbsf, the porosity seems to follow the
normal trend of compaction. Below 120 mbsf, the porosity remains relatively
constant with depth. The porosity trend below 120 mbsf is characteristic of a
migrating seal. The gas saturation (in weight) can be estimated from a
combination between the neutron porosity and density logs. The gas saturation is
very high. The shale content determined from the gamma-ray log (see main text)
indicates no significant sand/shale ratio variation. The fluid overpressure
increases almost linearly with depth until it reaches the fracture limit.
Parameters used:
  0
= 0.58,
  = 1.84 x 10⁻⁷
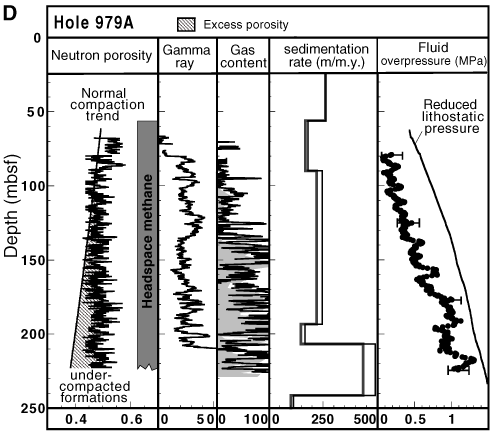
Pa-1. D. A porosity analysis of Hole 979A is illustrated. The
neutron porosity remains relatively constant with depth. The shale content
(determined from the gamma-ray log, see main text) indicates no significant
sand/shale ratio variations. The fluid overpressure increases almost linearly
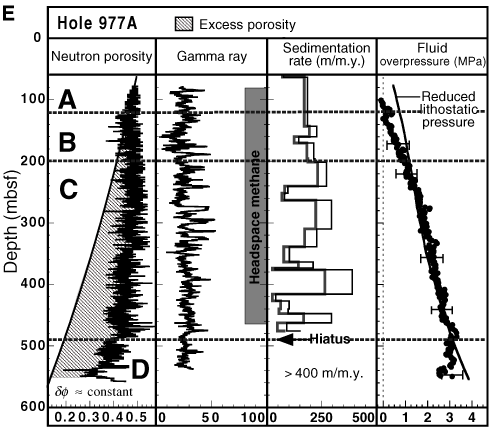
with depth. E. A porosity analysis from Hole 977A is illustrated. The excess
porosity computed from the neutron porosity indicates that the sediments at this
site are largely undercompacted. Four compartments can be observed (A-D). A
corresponds to a hydrostatic compartment. Between 120 mbsf and 200 mbsf
(compartment B), the fluid overpressure increases linearly with depth. Between
200 and 485 mbsf (compartment C), the decrease in porosity with depth seems to
be related to the fact that the fracture limit is reached (the fluid
overpressure cannot exceed the reduced lithostatic stress). Below 485 mbsf, the
excess porosity and the fluid overpressure remain constant with depth. The
boundary between compartments C and D is correlated to a hiatus in the
stratigraphic sequence indicated by biostratigraphic markers. Parameters used:
  0
= 0.53,
  = 1.27 x 10⁻⁷
Pa-1.

 0 = 0.53,
  = 1.41 x 10⁻⁷ Pa-1). Between 145 and 170 mbsf, there is an apparent increase of the porosity with depth and, below this depth, the porosity is higher than predicted by the (hydrostatic) normal trend of compaction. This anomalous porosity (dashed zone) is not caused by lithologic variations because the gamma-ray log, an indicator of a shale content, is fairly constant. It is interpreted as the result of fluid overpressure: the porosity in the formations between 145 to 250 mbsf has been "frozen" at shallower depths because of the presence of a sealing mechanism (a "fixed seal"), probably related to the presence of gas, which is indicated by the high-frequency variations in the porosity curve below 140 mbsf (see main text). Fluid overpressure (fluid pressure above hydrostatic) is estimated from the difference between the porosity predicted by the normal compaction trend and the porosity derived from the density log. The lithostatic pressure is derived by numerical integration of the density log. The reduced lithostatic pressure is defined as the lithostatic pressure minus the hydrostatic pressure. Below the seal, the fluid overpressure is observed to be close to the reduced lithostatic pressure, which indicates the presence of natural fracturing in the transition zone.
B. A porosity analysis of Hole 974C is illustrated. The porosity derived
from the density log decreases almost linearly with depth of burial from 40 mbsf
until reaching a transition zone at 100 mbsf. Such a decrease is characteristic
of equilibrium compaction and the normal compaction trend is indicated by the
solid (almost linear) curve (


![]()