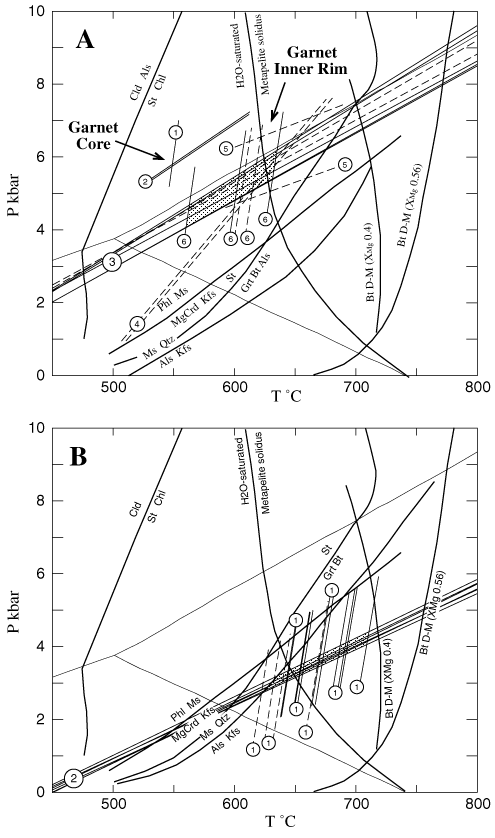
Figure 8. Thermobarometric estimates using Grt-Bt thermometry coupled with GASP, Grt-Pl-Ms-Qtz, and Grt-Pl-Bt-Qtz barometry. A. M1 mineral assemblage. 1 = Grt cores and Bt included within the inner part of Grt. 2 = Grt cores and Pl included within Grt. 3 = Grt inner rims and cores of matrix Pl. 4 = Grt inner rims and included Pl and Ms. 5 = Grt inner rims and included Pl and Bt. 6 = Bt included in inner Grt rims. B. M2 mineral assemblage. 1 = Grt external rims and rims of matrix Pl. 2 = Grt external rims and matrix Bt. The stippled areas represent likely metamorphic conditions for the M1 and M2 metamorphism in the high-grade gneisses. In both diagrams the following samples were used to obtain the Keq lines: interval 161-976E-14R-1 (Piece 3B, 40-45 cm) (solid lines) and interval 161-976E-14R-3 (Piece 1A, 10-14 cm) (dashed lines). Al2SiO5 phase relations after Chatterjee, 1991. Cld + Als = St + Chl and St = Grt + Bt + Als (KFMASH system) after Spear (1993). Phl + Ms = MgCrd + Kfs (KMASH system) after Spear (1993). H2O-saturated metapelite solidus after Thompson (1982). Ms + Qtz = Als + Kfs at Ptot = PH2O (Helgeson et al., 1978). Bt dehydration melting at XMg = 0.4 (calculated; Clemens, 1984). Bt dehydration melting at XMg = 0.56 (Le Breton and Thompson, 1988).


![]()