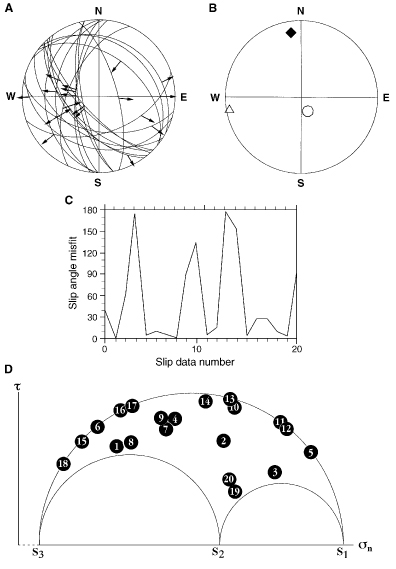
Figure 12. A. Lower hemisphere representation of the 20 fault planes mapped from BHTV data in Hole 976B. Inward and outward arrows correspond to normal and reverse faulting, respectively. B. Stress tensor derived from the inversion of the 20 fault planes and slip directions; r0 = (S1-S2) / (S1-S3). C. Angular difference between observed slip rake and that predicted by the solution stress tensor. D. Representation of each of the 20 fault planes in Mohr circles (adimensionalized as in Célérier, 1988).