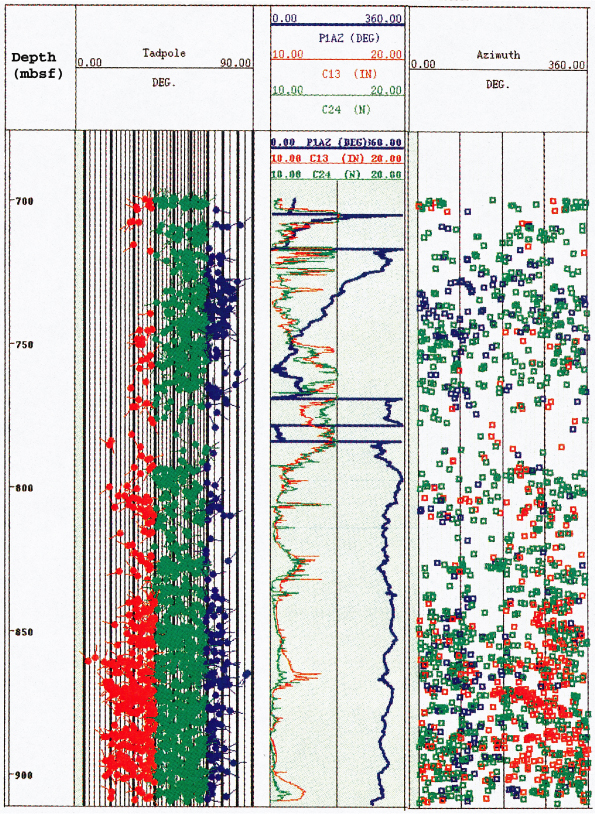
Figure 5. Summary of results from FMS image analysis in Hole 976B, using FracView. Left: Depth below seafloor (left) associated with the 1600 individual conductive events mapped from FMS images and presented in terms of dip angle and azimuth as a "tadpole." The planes are here presented in three sets with respect to dip angle: horizontal (0°-30°; red), intermediate (30°-60°; green), and steep (60°-90°; blue). Center: Orientation with respect to north of pad #1 of the FMS tool into the hole represented as P1AZ. Orthogonal calipers (C13 and C24) describe the variations in borehole size, outlining the presence of fault zones with large values. Right: Summary of the 1600 planes mapped presented in terms of dip direction. The lower density of planes mapped between 770.0 and 780.0 mbsf is locally a result of poor image quality related to large hole size.