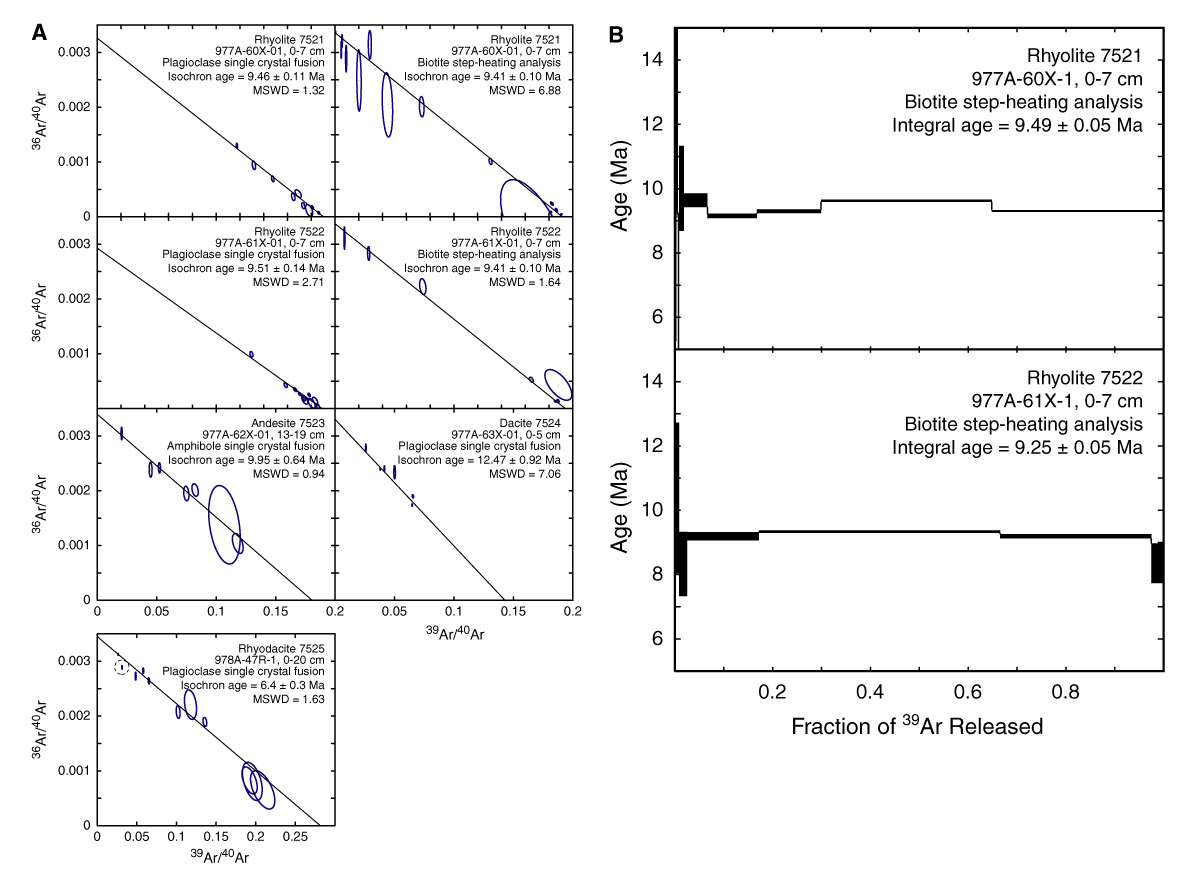
Figure 5. A. Inverse isochron diagrams show the best-fit regression lines. Argon isotope ratios of single plagioclase and amphibole phenocrysts, and biotite step-heating are shown with 1- error ellipses. Analyses are normalized to a common J-value of 1 x 10⁻⁴. Dashed encircled points are excluded from regressions. B. Age spectrum diagrams showing the results of laser step-heating analyses of biotite crystals from rhyolites 7521 and 7522. Mean apparent ages of heating steps are shown with 1- error bars.