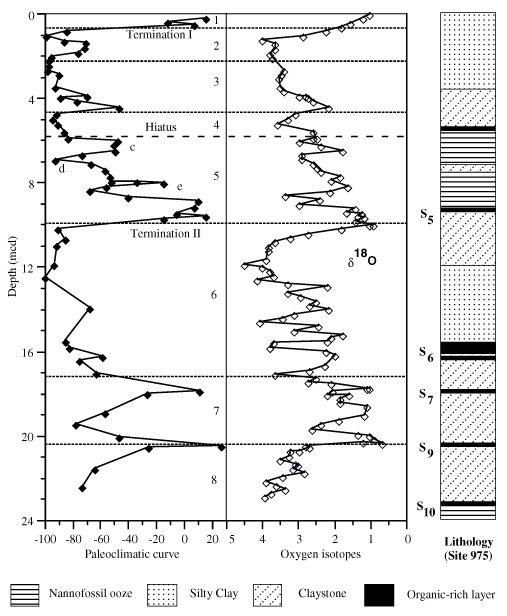
Figure 5. Comparison between the paleoclimatic curve obtained from the planktonic foraminifer assemblage (see text for details) and the oxygen-isotope data (Pierre et al.,
Chap. 38, this volume) from Site 975. Dotted lines = oxygen-isotope boundaries; dashed line = a hiatus recognized between the oxygen-isotope stages 4 and 5c. Small discrepancies between the foraminifer and oxygen-isotope records are related to the different holes used for the two proxies.


![]()