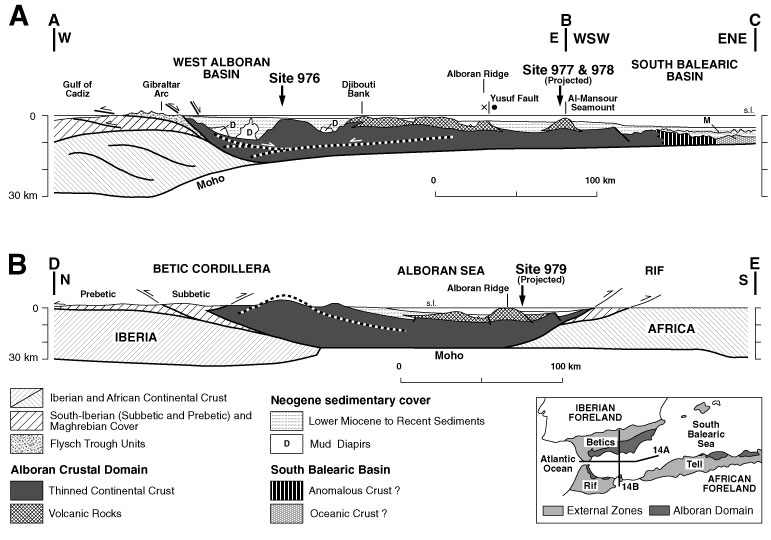
Figure 14. A. Schematic true-scale section from the Gibraltar Arc to the South Balearic basin to illustrate the east-west crustal structure of the westernmost Mediterranean (modified from Comas et al., 1993; Comas, Zahn, Klaus, et al., 1996), based on a synthesis of structural data from the Gibraltar region and MCS profiles in the Alboran Sea, 3D modeling, gravity consideration, surface heat-flow, and elevation data (Torné et al., unpubl. data). The modeled crustal thickness beneath the Alboran Sea is in agreement with available seismically derived estimates of the Moho depth. B. Schematic true-scale section to illustrate the north-south crustal structure of the Alboran Basin, based on a synthesis of structural data from Spain and Morocco and Conrad seismic lines and on a density model obtained by comparing observed and calculated Bouguer anomaly data (Watts et al., 1993). Note that both crustal sections confirm the thinning of the continental crust beneath the Alboran Basin, but modeling different data resulted in discrepancies on crustal-thinning values. A more conclusive estimate of crustal thickness variations deserves additional refraction and wide-angle reflection seismic data. The intracrustal reflectors (hatched white lines in the Alboran Domain), shown by the MCS Conrad profiles
(Figs. 16-19 on back-pocket foldout, this volume), are interpreted as extensional detachment faults or the top of the reflective lower crust.