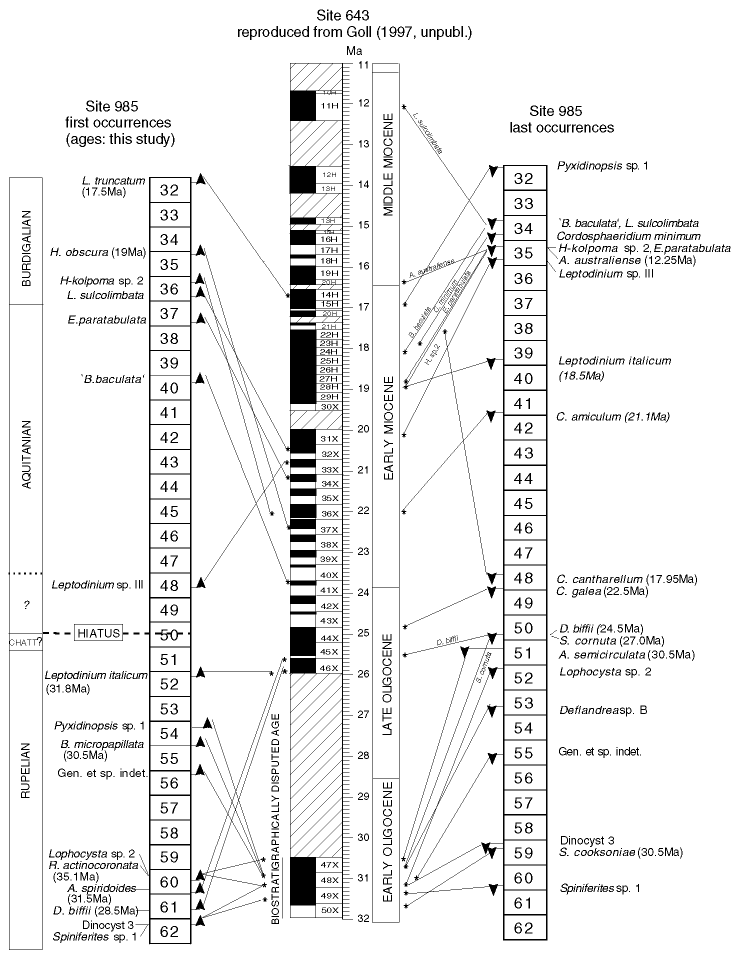
Figure 4. Dinocyst first and last occurrences in Site 985 cores compared to corresponding events in Site 643 (Leg 104). The center column shows Site 643 cores (recovery in black) and interpreted hiatuses (hatched) vs. the absolute time scale (reproduced from R.M. Goll, unpubl. data).
