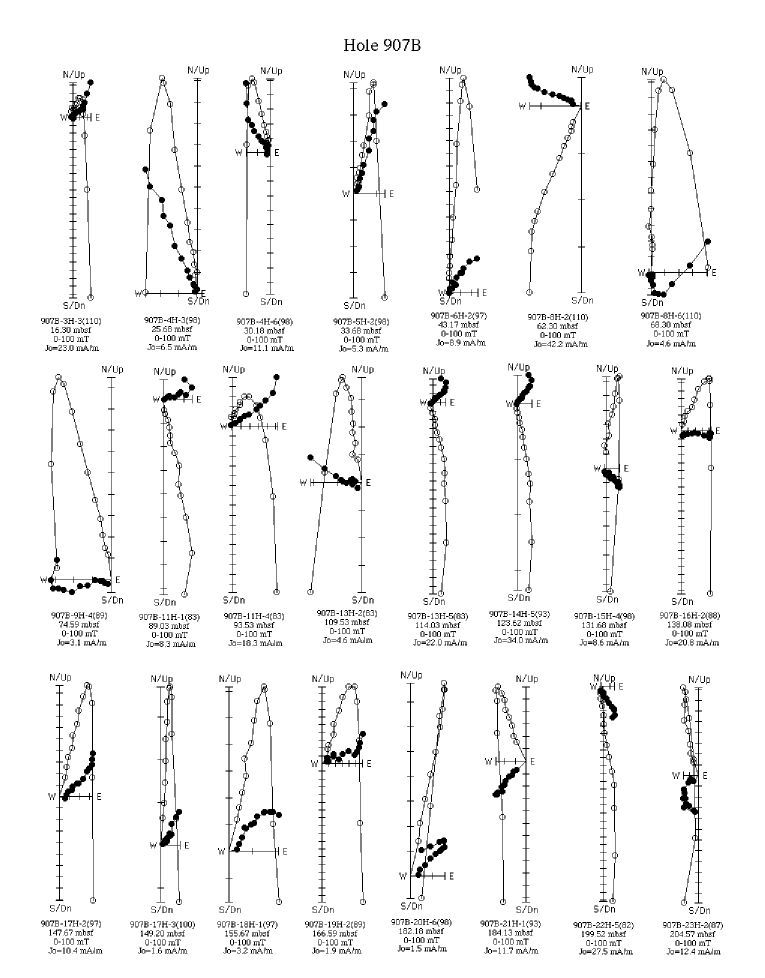
Figure 2. Orthogonal projection of AF demagnetization data from discrete samples in the 0-210 mbsf interval of Hole 907B. Open and solid symbols indicate projections on the vertical and horizontal planes, respectively. Jo = magnetization intensity before demagnetization, Dn = down. Numbers in parentheses indicate sample location (in centimeters).
