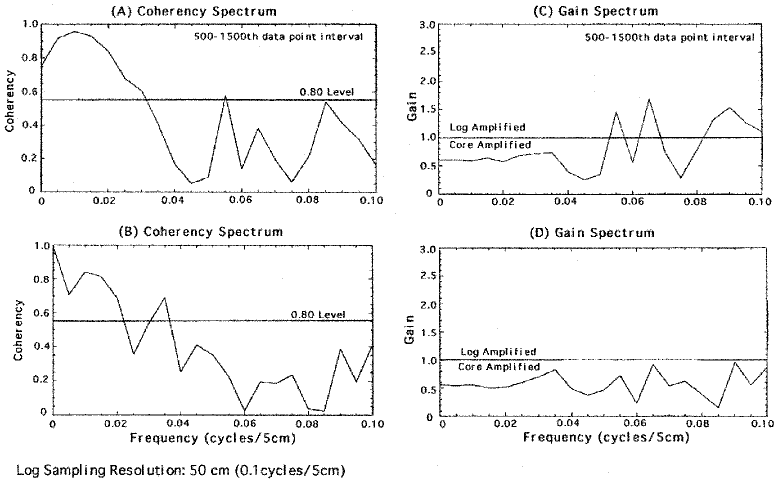
Figure 4. A. Coherency spectrum for empirical SUMT resolution of 53 cm for the interval from 123 to 173 mbsf that showed the best mapping between core and log magnetic susceptibility data. B. Coherency spectrum for theoretical SUMT resolution of 0.50 m. C. Gain spectrum for the interval from 123 to 173 mbsf where log resolution is amplified relative to core magnetic susceptibility. D. Gain spectrum for the interval from 90 to 260 mbsf showing typical amplification of core magnetic susceptibility over log data.
