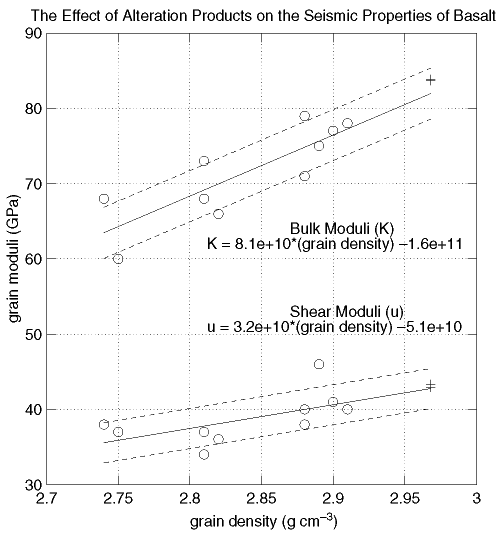
Figure 6. Bulk and shear grain moduli vs. grain density derived from the inversions of the high-pressure P- and S-wave data for all of the samples. A decrease in grain density corresponds to an increase in alteration products. The correlation shown between grain moduli and grain density suggests that an increase in alteration lowers the grain moduli. A least-squares-fit (solid line) is shown along with one standard deviation bounds (dashed lines). The standard deviations for the fits to the bulk and shear moduli are 3.4 and 2.7 GPa, respectively. Also shown are the Hashin-Shtrikman bounds (crosses) for a zero-porosity rock composed of 50% plagioclase and 50% augite. (The bulk and shear moduli used for plagioclase are 75 and 34 GPa, and those used for augite are 96 and 58 GPa [Christensen, 1982]). The Hashin-Shtrikman bounds fall within one standard deviation of the least-squares-fit line, suggesting consistency between these modeling results and the theory of Hashin and Shtrikman (1963).
